

Market Data

March 6, 2014
Mill Lead Times Respectable Yet Mills Willing to Negotiate Steel Prices
Written by John Packard
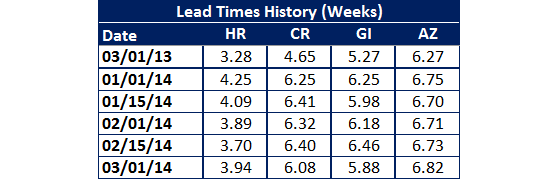
Domestic mill lead times continue to be better than they were at this time last year. Hot rolled lead times averaged 3.94 weeks, according to our survey respondents. This is better than the 3.28 week average of one year ago.
Cold rolled lead times were reported to be at an average of 6.08 weeks (4.65 weeks last year), galvanized 5.88 weeks (5.27 weeks last year) and Galvalume 6.82 weeks (6.27 weeks last year).
Earlier this week a service center executive told me that he felt lead times would start to extend as we move out of the excessive winter weather and release pent up demand. Usually with longer lead times we see less willingness by the domestic mills to negotiate and tighter steel prices.
Steel Market Update received a call from a large service center executive earlier today who commented that they were seeing “positive signs” in the marketplace regarding demand and yet steel prices continued to go down.
The domestic mills continue to be receptive to negotiating prices on virtually all flat rolled products. Hot rolled pricing appears to be the most negotiable based on the results of this week’s flat rolled market survey. Following close behind are galvanized, Galvalume and then cold rolled. As you can see by the graphic below, flexibility appears to be the word of the day.
In the real world, SMU is aware of extras and freight as being the two primary areas in negotiation followed by adjustments to base pricing.
Steel prices have been dropping since the middle of January. When looking at hot rolled prices, they peaked the first week of January. Prior to the first week of January we saw prices trending sideways during the second half of 4Q 2013 and prices moved higher during early 4Q. You can see the lack of downward price pressure in the numbers in the graphic below.


