Market Data
April 1, 2014
March at a Glance
Written by John Packard
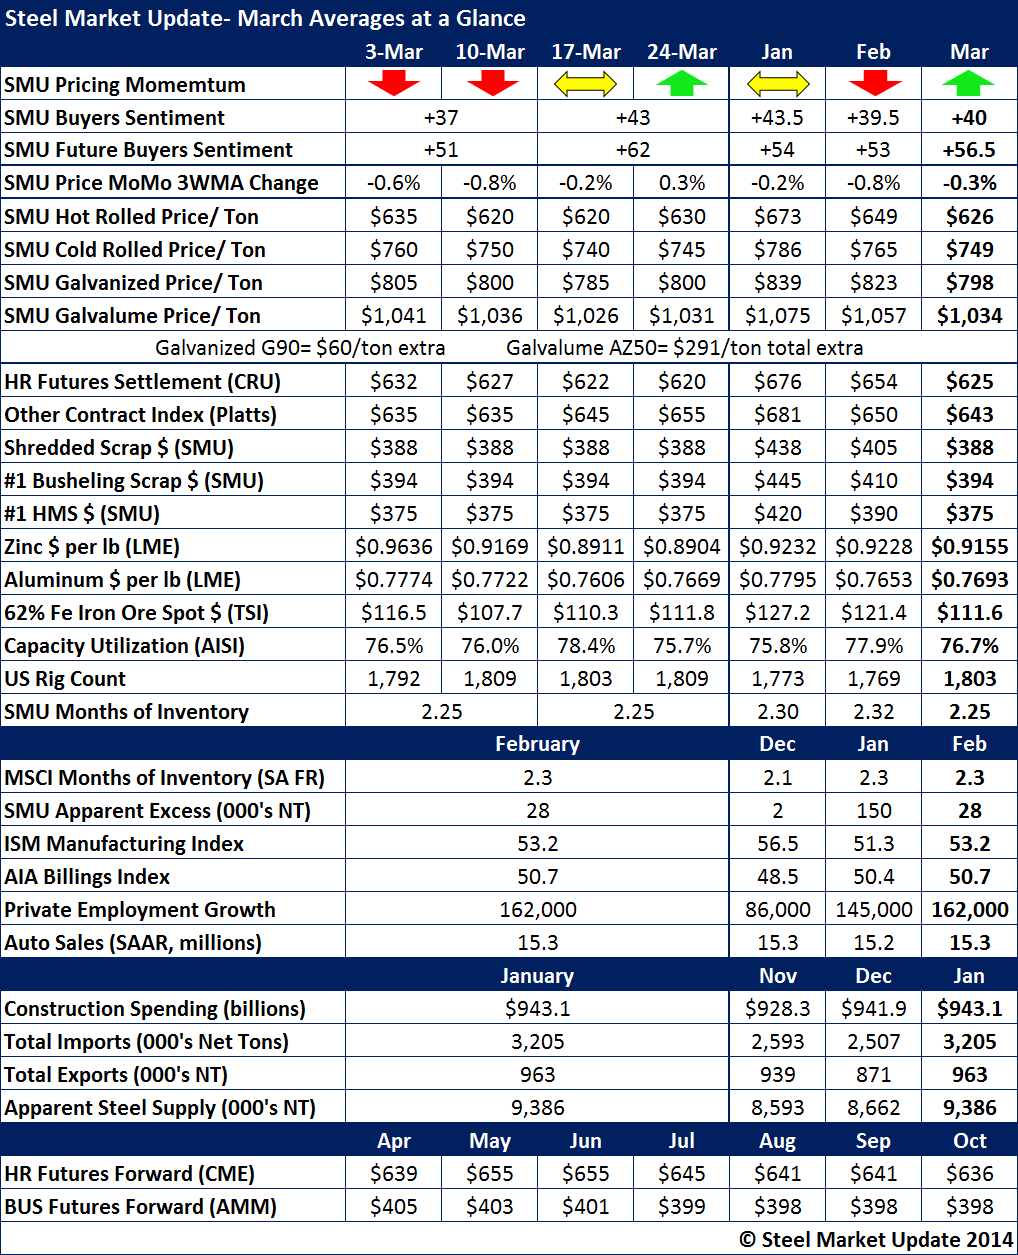
Flat rolled steel pricing momentum reversed course due to the price increase announcement led by ArcelorMittal and followed by virtually all of the domestic and Canadian steel mills. We moved the SMU Price Momentum Indicator first to Neutral and then a week later to Higher in response to the increase announcements and the fact that the mills began collecting higher prices on flat rolled steels.
The SMU Steel Buyers Sentiment Index last measured in mid-March was +40 which is well within the optimistic range of our Index.
Hot rolled prices averaged $626 per ton for the month which was $1 per ton higher than the CRU average of $625 per ton. We are adding a new line item to our monthly recap. The line item is noted as Other Contract Index Platts so our readers can compare CRU, Platts and SMU with CRU and Platts now being used as contract adjustment vehicles. Platts average for HRC for the month was $643 per ton, $18 per ton higher than CRU and $17 per ton higher than SMU.
Scrap prices were down in the Chicago area markets. Iron ore spot pricing in China was also down although the commodity has been bouncing back over the past few days.
SMU service center inventories stood at 2.25 months as of mid-March while MSCI had their inventories at 2.3 months on a seasonally adjusted basis as of the end of February.
Auto sales have been lower than originally forecast at 15.3 million units (annualized) at the end of February. Projections are for sales closer to 16.5 million units during the full calendar year.