

Market Data
July 16, 2014
Premium Content Overview: SMU Key Market Indicators
Written by John Packard
As you may have noticed, we have been writing a series of articles highlighting the benefits of our Premium membership. Through the end of July, our Executive members will have access to our Premium content. If you have not yet explored our Premium content, such as SMU’s survey data or imports by product/port/country, I would encourage you to do so.
Today’s article will focus on SMU’s “Key Market Indicators.” Many of you are familiar with our contributing writer and Steel 101 instructor Peter Wright. Peter provides analysis for many topics that SMU covers such as net imports, apparent supply of sheet & strip products, construction expenditures, etc.
Much of this data is compiled by Peter into a meta-analysis of indicators which we call “Key Market Indicators” and is published once a month. Key Market Indicators are composed of economic and steel industry factors which are broken into the following categories: General Economy, SMU Indices, Long Product Steel, Flat Rolled Steel, Construction, and Manufacturing.
SMU has developed a “quick view” chart which is designed to give a snapshot of the steel market on a specific date. The chart is stacked vertically to separate the primary indicators. The indicators are classified as leading, coincident or lagging as indicated. See the latest snapshot below:
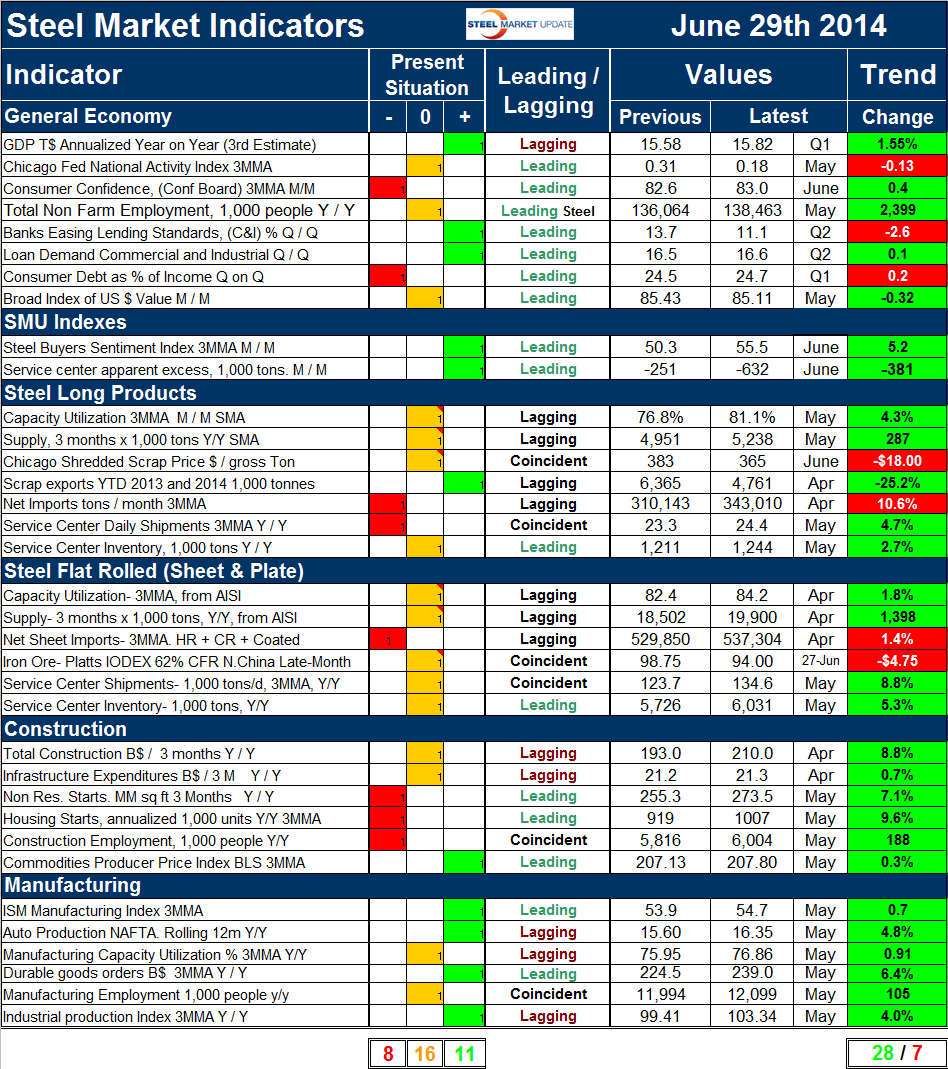
As you can see from the chart, the specific indicators include:
• Automotive Production
• Chicago Fed Index
• Chicago Fed Mid-West Index
• China Economic Statistics
• Consumer Confidence
• Consumer Debt
• Currency Update
• Durable Goods Analysis
• Employment Net Job Creation
• Housing Data Analysis
• Industrial Production
• ISM Index Analysis
• US GDP
• Service Center Analysis
• Canada Service Center Analysis
The real key to our “Key Market Indicators” is that it can serve as a useful tool and resource for forecasting the direction of the steel economy. Columns in the chart are designed to differentiate between the current situation and the direction in which the market is headed. The present situation is sub-divided into below the historical norm (-), (OK), and above the historical norm (+). The “Values” section of the chart is a quantitative definition of the market’s direction. In cases where seasonality is an issue, the evaluation of market direction is made on a three month moving average basis and compared year over year to eliminate this effect. Where seasonality is not an issue concurrent periods are compared. The date of the latest data is identified in the third values column. Values will always be current as of the date of publication. Finally, the far right column quantifies the trend as a percentage or numerical change with color code classification to indicate positive or negative direction.
Premium subscribers may reference any of the indicators for the most up to date analysis. Each indicator data set utilizes SMU’s interactive graphing tool to allow you to visually compare data subsets and interact with a data timeline. Similar to our price index, you may turn on and off different data subsets as you view the indicators.
Accessing the Key Market Indicators is easy. Simple go to the analysis tab and a drop down column will appear. Click on “Indicators” at the bottom of the list. That will take you to the Key Market Indicator page and will display the current snap shot.
We hope that you will explore and take advantage of all the great features of our Premium membership during this trial period. Remember, if you like what you see, you can always upgrade your membership to Premium at any time. If you have any questions about our Key Market Indicators or Premium memberships, please feel free to contact us at info@steelmarketupdate.com.


