

Market Data

July 20, 2014
SMU Comparison Price Indices: Some Movement Seen
Written by John Packard
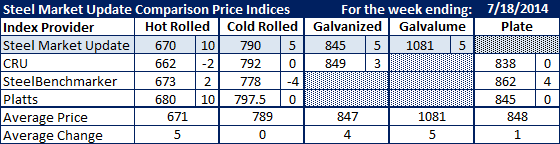
Steel Market Update watches a number of flat rolled steel indexes and once per week we provide our readers an analysis of what movement has occurred in each during the prior week. This week we found small movements, mostly indicating higher prices, in most of the indices. Hot rolled saw two indexes moving prices by $10 per ton (SMU and Platts) while CRU was down $2 and SteelBenchmarker was up $2 per ton. Our HRC price average of the indices followed was $671 per ton up $5 per ton from one week earlier.
Cold rolled remained relatively stable and our average of the indices saw no movement remaining at $789 per ton.
Galvanized was up very modestly with our average increasing by $4 per ton to $847 per ton. The same can be said for Galvalume where our index saw AZ prices up $5.
Our plate price average rose by $1 to $848 per ton.
FOB Points for each index:
SMU: Domestic Mill, East of the Rockies.
CRU: Midwest Mill, East of the Rockies.
SteelBenchmarker: Domestic Mill, East of the Mississippi.
Platts: Northern Indiana Domestic Mill.


