

Prices

August 17, 2014
Accuracy of Import License Data for 1st Six Months 2014
Written by Peter Wright
One of our contributing writers (and Steel 101 instructor) Peter Wright, analyzes foreign steel import data once every couple of months in order to see how accurate the license data is trending versus the Final Census data which is produced once per month (2 months behind receipt of foreign steel). We recently received Final Census Data for the month of June 2014. SMU, through Peter Wright, produces foreign import articles where he uses a three month moving average as a way of making the data more viable. Separately, SMU produces reports 3 to 4 times per month based on the current and prior month license data in order to track how import volumes are trending by product. Our most recent report was produced on Thursday of this past week (SMU August 14, 2014 must be logged in to access article from link).
Steel import data is reported three times for each month. These reports are licensed, preliminary and final tonnages for each product. The Steel Import Monitoring system has been a widely used tool to provide an advanced look at import volumes using data compiled from import licenses. These licenses can be applied for at any time between when the vessel ships to ten days after it arrives so there is not an exact overlap with a calendar month of receipts. The total licensed tonnage for any product in a given month is available on the first Tuesday of the following month, which is about three weeks before the preliminary numbers and about five weeks before the final numbers are released.
We decided to investigate the degree to which the license numbers for flat rolled products accurately predict the final volume throughout the course of 2014, expecting that, as the year progressed, the total license and final data for the year to date would converge.
We first published this analysis using data for the first four months of 2014 and saw how close the preliminary and final numbers are. Sometimes they are identical over large volumes. Moving on to examine the licensed data we saw that through April the total final tonnage of flat rolled products was 4.6 percent greater than the licensed volume. We have now updated this analysis through June final import data and find that the difference between the final tonnage and the licensed tonnage in the first six months of the year has declined to 3.79 percent, (Table 1).
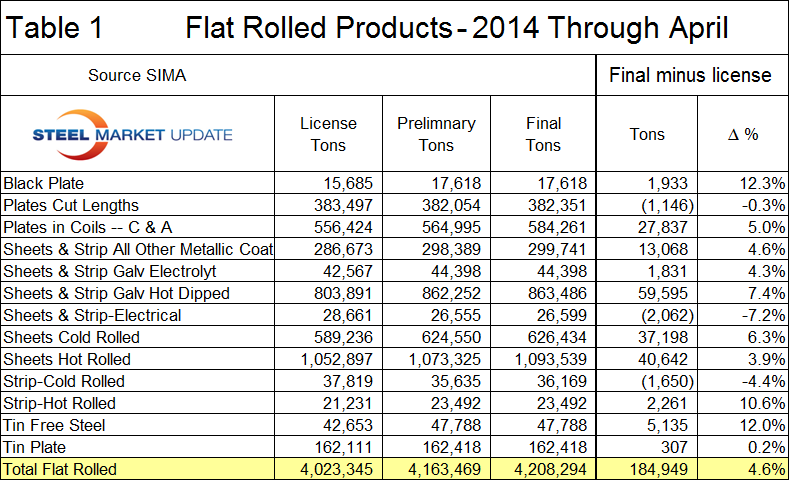
If we ignore black plate where the tonnage is very small, we can see that the difference between final and licensed varies from + 7.76 percent for electro galvanized sheet and strip to – 1.83 percent for electrical sheet and strip. The biggest tonnage item, hot rolled sheet, receipts were only 1.6 percent greater than the licensed tonnage.
We assume that actual permits can be more than licenses because permits can be obtained after the steel has arrived in the US. In a study such as this, the problem is that the date of the license can vary by weeks but the date of arrival is a fact. At SMU we routinely produce import reports that are based on a three month moving average of the latest import tonnages and use. For example, in our July update we use the May final tonnage, the June preliminary tonnage and the July licensed tonnage. Our conclusion from this license accuracy investigation is that the ability of the licensed data to predict the final volume is in the ball park in most cases and that our practice of compiling it in a three month moving average is viable. We expect the difference between licensed and final tonnage to continue to shrink as we continue this analysis to include subsequent months of 2014.


