Prices

September 11, 2014
Flat Rolled Steel Import Analysis & Trade Suits
Written by John Packard
For months there have been rumors circulating in the marketplace that the domestic steel industry was contemplating filing dumping suits against the Chinese on cold rolled and potentially a number of Asian countries on galvanized and/or Galvalume products. To date there have not been suits filed and the foreign steel continues to arrive at ever-greater numbers.
The industry still believes suits will be filed. When speaking to the analysts at our Steel Summit Conference this past week, many had built into their “bullish” forecasts a jump in flat rolled pricing based on the suits being filed during calendar year 2014.
John Anton, Director or Steel Services for IHS Global, pegged his 2015 peak number for hot rolled coil at $750 per ton based on flat rolled suits being filed (and many other reasons). Timna Tanners was not so sure that suits would be filed and her average for HRC for 2015 was $625 per ton due to competitive pressures from the rest of the world and the decline in iron ore pricing.
So, the flat rolled steel industry is basing much of their bullishness on something not directly connected to supply or demand balances but instead the fear of trade suits.
Since the threats of dumping have existed for quite some time now, trading companies and end users have had time to adjust buying patterns. We have seen increases in tonnages out of some of the countries being mentioned and we have seen new steel mills – particularly out of Europe and now Brazil – entering the market and essentially replacing Asian sources of supply. It will be interesting to see if the Asian tonnage is reduced in the coming months even if the suits are not filed and, those of Europe and South America rise in their place.
As Peter Wright mentioned in his article regarding Net Imports, the domestic flat rolled steel industry has been unable to capture the increased demand. This is due to the wide spread we have seen between domestic and foreign prices over an extended period of time resulting in huge market gains for foreign steel during 2014 vs. 2013. Take a look at Peter’s report (next article after this one) and pay attention to the 3MMA domestic shipments table. Compare it against the foreign tonnages and do some quick calculations to determine the penetration foreign steel has by product. You might be surprised.
During our Steel Summit Conference, John Ferriola (Nucor CEO) would not comment on any future specific trade suits but in his statement he noted the success of the oil country tubular goods (OCTG) case and that Nucor would use the trade laws of the United States to protect against unfairly traded goods.
The two attorneys, Roger Schagrin (who represented the OCTG producers against foreign imports) and Lewis Leibowitz (who represents the consumer and trading companies’ interest) could not comment about any potential filings. Mr. Leibowitz did make a comment that any new trade cases would need to be filed prior to the end of the month of September. If not, the mills would need to update all of their documents to include data through the third quarter as opposed to just through the end of second quarter.
Meanwhile, the foreign steel keeps on coming.
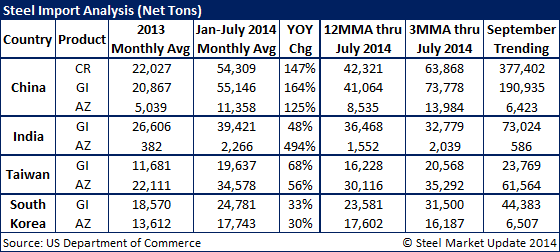
Steel Market Update spend some time looking at the most recent license and census data released by the U.S. Department of Commerce through the 9th of September. We concentrated our energies on Chinese cold rolled, galvanized and Galvalume imports along with galvanized and Galvalume imports from India, Taiwan and South Korea. These four countries are those most often associated with dumping complaint discussions within the industry (i.e. the “rumor” mill).
September Cold Rolled Imports Could be Largest Month Since Before Great Recession Began
Based on license data through the 9th of September, imports of cold rolled are anticipated to be a levels not seen since prior to the beginning of the Great Recession. As of this week there are 162,400 net tons of license requests for the month of September. In August there were a total of 193,480 net tons for the entire month. June was the largest month for imported cold rolled so far this year with 233,790 net tons of cold rolled received into U.S. ports.
Chinese Cold Rolled Imports Surging / Canada Shrinking
During all of 2013, Chinese steel mills exported an average of 22,027 net tons per month to the United States. The Chinese monthly average through from January 2014 through July 2014 is up 146.5 percent to 54,309 net tons. However, when looking a single month import data, during April 2014 the number of tons had increased to 105,236 net tons. Chinese exports of cold rolled did drop back in May, June, July and August but were still well above 2013 levels. Based on September license data the Chinese are poised to break out as they already have 113,220 net tons of license requests as of the 9th of September. If license requests continue at the current pace we could see Chinese exports of cold rolled to the U.S. reach or exceed the 200,000 net ton level.
To put this into perspective, in August there were only 193,480 net tons (total) of licenses requested. As we look at September there is only one other country who has requested cold rolled licenses of 10,000 net tons or more. That is the United Kingdom. Canada has only requested 1,028 net tons for the month of September. Canada normally ships approximately 40,000 net tons of cold rolled to the U.S. on a monthly basis.
In September 2013 the total number of tons of cold rolled imported by the United States was 107,263 tons and China accounted for 18,636 net tons of the total. What a difference a year makes…
September Galvanized Imports Showing Growth from China, Italy, Netherlands, Japan & South Africa
Turning to galvanized imports, May was the largest month for galvanized so far this year at 294,306 net tons. So far this month (September) there are 147,222 net tons of license requests which projects out to be around a 300,000+ net ton month should the rate continue at the current pace.
During calendar year 2013 the U.S. imported an average of 173,097 net tons per month. Through the first seven months 2014 that average rose to 246,402 net tons, a gain of 48.7 percent.
Chinese mills have already requested 57,280 net tons of galvanized licenses through the 9th of September. They have by far the largest tonnage with India in second position at 21,907 net tons. Canada, which normally ships approximately 70-80,000 net tons to the U.S. per month (2014) has so far requested 2,847 net tons.
China averaged 20,867 net tons of galvanized exports to the U.S. during 2013. Their three month moving average (May, June, July 2014) is 73,778 net tons. Their biggest month this year was July at 84,852 net tons. September should come in greater than their previous high.
We are seeing growth in other countries on galvanized exports to the U.S. during 2014. India, which averaged 26,606 net tons during calendar year 2013 is now averaging 39,421 net tons for the first seven months 2014. South Korea averaged 18,570 net tons last year and for the first seven months 2014 they are up to 24,781 net tons. Taiwan, averaged 11,681 net tons during 2013 and now they average 24,781 net tons.
Italy is making inroads into the U.S. galvanized market essentially doubling their tonnage in August compared to one year ago and looking like they will double September 2014 vs. September 2013 tonnages as well. Italy currently has 15,048 net tons of license requests in place for September.
Japan is also coming on strong and appears poised to quadruple their tonnage in September 2014 compared to one year ago. Japan has 9,385 tons of license requests vs. 2,168 net tons one year ago.
The Netherlands is another country making inroads into the U.S. galvanized market with 9,414 net tons of license requests vs. shipments last September totaling 4,694 net tons.
South Africa is back in the market with 4,093 net tons vs. zero tons last September.
Galvalume Imports Continue at Very High Levels
May, July and August each saw Galvalume imports exceeding 100,000 net tons per month (June dropped down to 73,242 net tons). If you look at the report Peter Wright has written (article after this one) you may note that the domestic steel mills 3 month moving average for “other metallic” is 117,873 net tons per month. Foreign steel is close to taking 50 percent or more of the Galvalume market.
The largest supplier of Galvalume has been Taiwan which averaged 22,111 net tons during calendar year 2013 and now average 34,578 net tons for the first seven months 2014. This represents a growth rate of 56 percent so far this year.
South Korea has also been growing their “other metallic” (mostly Galvalume) business this year which is up 30 percent compared to last year.
What’s next?
Well, the ball is in the domestic mills’ court. As they mull their options we are hearing from many steel buyers that they continue to purchase foreign steel.
And everyone (outside of the domestic mills) continues to be amaze at the resiliency of U.S. prices which have held relatively firm during calendar year 2014 despite the influx of foreign steel.