Market Data
September 15, 2014
Manufacturing & Steel Production Forecasts for 2015
Written by Peter Wright
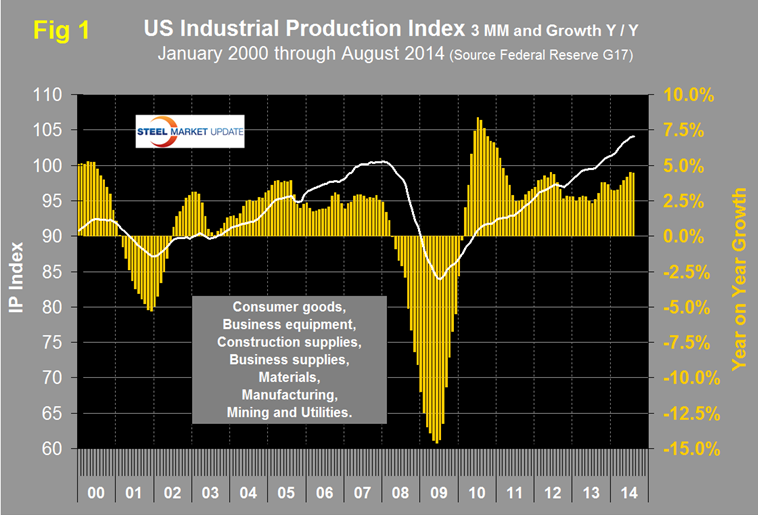
Industrial production (IP) and manufacturing capacity utilization for August 2014: Both of these data points are reported in the Federal Reserve G17 data base. The IP index was reported as 104.12 for August, a decline of 0.1 percent from July. This is another example where the individual month’s result can be misleading. The three month moving average (3MMA) was 104.11 which was the highest value ever and the third straight month where the growth of the 3MMA exceeded 4 percent year over year. This was the ninth consecutive month for the index to exceed the pre-recession peak of September 2007. The 3MMA has expanded for 21 straight months and is up by 4.4 y / y. Data is seasonally adjusted. This index is based on the July 2007 level being defined as 100, (Fig 1).
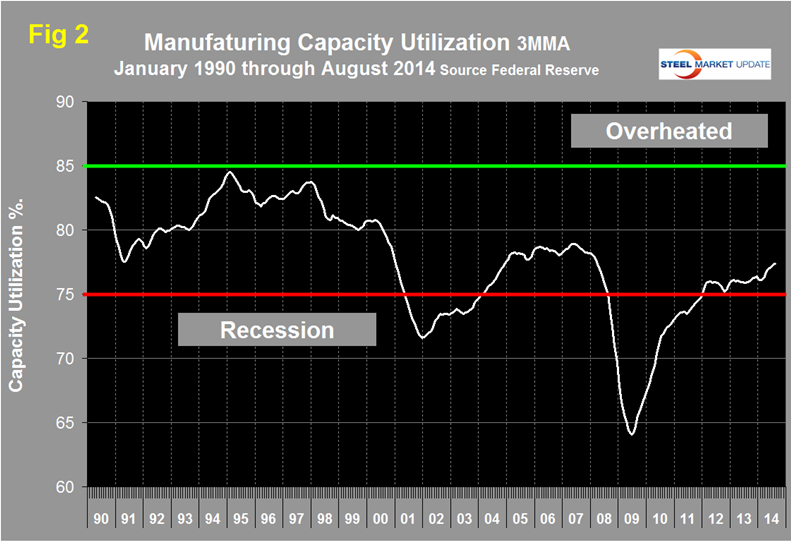
Manufacturing capacity utilization was 77.19 percent in August with a 3MMA of 77.35 percent, up slightly from 77.33 in July and now has a string of six months of improvement, (Fig 2). The 3MMA is now the highest since March 2008.
Every three months MAPI (The Manufacturers Alliance for Productivity and Innovation) provides a detailed look at the health of the domestic manufacturing sector and reviews the performance of a selected group of its most important subsectors. The latest report released September 9th covered the actual data available through July 2014 and provides forecasts, completed in mid-August 2014. Some key points were as follows.
Production declined very sharply in January (particularly because of weather) but rebounded dramatically in February, more than offsetting the January decline. Manufacturing industrial production increased at a 5 percent annual rate in the three months ending July 2014. Production activity from March through July was exceptionally strong in light of the sluggish GDP growth so far this year. For example, inflation-adjusted GDP increased at a 0.9 percent annual rate in the first half of 2014. Manufacturing production, however, grew at a 4 percent annual rate.
The manufacturing outlook for 2014 and 2015 calls for an acceleration in the growth rate each year. In addition, manufacturing will continue to grow faster than the overall economy. The proximate cause for faster industrial growth is that demand has shifted toward manufactured goods. Durable goods, equipment, and construction have long lives and therefore are temporarily postponable, especially during economic downturns and times of uncertainty. Consumers and firms sit on the sidelines until the goods wear out, growth necessitates additional capacity, and/or confidence returns.
Motor vehicle sales and housing starts are traditional bellwethers for consumer durables–driven manufacturing. We expect auto sales to increase 5 percent in 2014 and 3 percent in 2015. Housing starts should grow 10 percent this year and 29 percent in 2015, and this growth will accelerate purchases of appliances and other household goods. The rebound in big-ticket consumer spending is supported by steady employment gains, households’ low debt burdens, and rising consumer wealth (a factor of higher stock and home prices).
Business investment responds to the ability to borrow and the need for capacity. Firms have lots of cash and are profitable, and falling unemployment indicates higher utilization rates. Further, several growth themes create an incentive for investment. The energy infrastructure for unconventional oil and natural gas has revived domestic drilling and the need for distribution pipelines and terminals. Residential and nonresidential construction are rebounding, and both have extended supply chains that include many manufactured goods.
The needs for new capacity and replacement cycles have converged for all types of transportation equipment—autos, trucks, airplanes, ships, and railroad. An aging population has accelerated the demand for medical care, including medical supplies and equipment. Furthermore, the manufacturing industry itself is attracting significant investment in machinery and structures thanks to the faster pace of growth and widening backlogs driven by the above themes. The acceleration in investment-driven and consumer-driven manufacturing will underpin an acceleration in material industries production.
Manufacturing production is forecast to grow 3.4 percent in 2014, 4.0 percent in 2015, and 3.6 percent in 2016.
Iron and steel products production
Iron and steel production is forecast to increase 1 percent in 2014, 7 percent in 2015, and 4 percent in 2016.
Output was up 4 percent in the three months ending July 2014 versus the same period one year ago. Compared with February 2014 to April 2014, the production momentum accelerated at a 20 percent annual rate.
Capacity utilization in the U.S. steel industry was 80 percent in the week of August 16, 2014 (up from 78 percent in 2013), a higher factory utilization rate than for overall manufacturing.
U.S. durable goods manufacturing industries’ momentum was up 10 percent during May to July 2014 compared with February to April 2014; these are predominantly steel-intensive industries.
Steel production was up 1 percent in Europe (28 countries), 10 percent in Korea, and 6 percent in Russia in the three months ending July 2014 compared with year-ago levels. China’s steel production rose only 6 percent and Taiwan’s steel production was up 2 percent.
Steel product imports rose 26 percent while exports were flat; the trade deficit was significantly more negative in the second quarter of 2014 compared with one year ago.
The Federal Reserve Beige Book released on September 9th reported as follows. “Within manufacturing, growth was reported across a broad base of sectors. Increases in auto production or derived demand for steel and other related products were cited by Philadelphia, Cleveland, Chicago, and Dallas. San Francisco cited increases in steel capacity utilization over recent months. Cleveland cited slightly lower steel shipments because of seasonal factors but indicated underlying demand was strong. Construction was cited as a source of increased demand by manufacturing contacts in the Philadelphia, Chicago, Minneapolis, and Kansas City Districts. Chicago reported that demand for heavy machinery picked up some on net, as higher demand for construction machinery overshadowed weakness for agricultural and mining machinery. Firms in the Boston District reported strengthening demand for semiconductors, while San Francisco reported that demand for semiconductors strengthened in part because of robust orders from other countries. With the exception of motor vehicle producers, manufacturers in the Atlanta District generally reported weakness in new orders and shipments.
“Manufacturing associated with the energy sector was cited as a continued source of growth by Philadelphia, Cleveland, and Dallas. Contacts in most Districts expressed optimism about the near-term outlook for manufacturing growth. Moreover, in the New York, Philadelphia, Richmond, and Atlanta Districts, optimism reportedly increased in comparison with the previous reporting period. Boston and Cleveland reported that current capital spending is roughly in line with earlier plans. Kansas City indicated slightly diminished capital spending plans, but the outlook remained solidly positive across contacts.”
The Beige book had this to say about residential and commercial construction. “A little over half of the Districts reported some degree of growth in nonresidential real estate activity, with increased construction, leasing, or both tied to steady or falling vacancy rates and to rent increases. None of the Districts reported a decline in overall activity, although New York and St. Louis described activity as mixed. In addition to traditional office space, certain Districts reported increased demand for specific projects: Boston noted demand for construction in the hospitality sector, Philadelphia cited industrial and warehouse projects, Richmond noted distribution centers, and St. Louis reported new retail and mixed-use projects as well as new industrial facility construction. Barely half of the Districts reported stable or growing residential real estate activity related to the construction of new homes and sales of existing houses. New construction and existing home sales generally grew modestly; market conditions tended to vary by metropolitan area and by neighborhood within metropolitan areas. Boston, New York, and Dallas reported high levels of ongoing multifamily construction projects; Chicago reported a moderate pace of growth, and San Francisco noted a pickup in activity.”
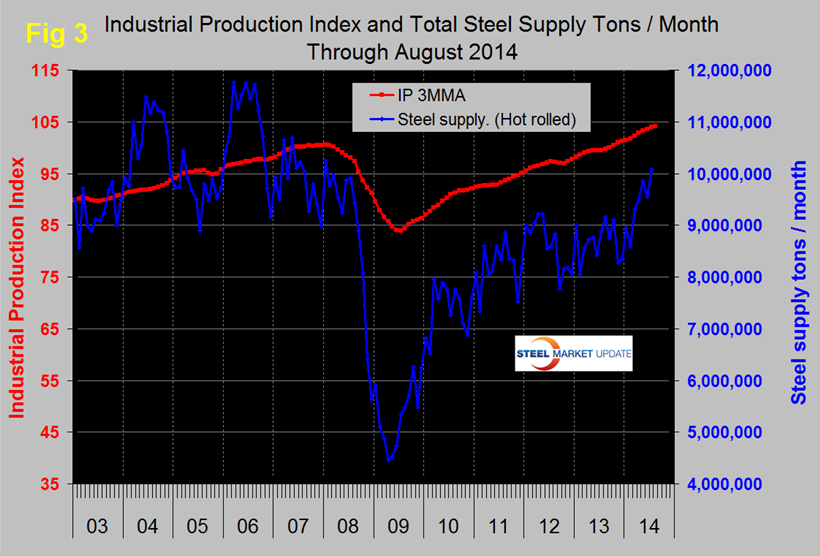
SMU comment: we are very encouraged by the MAPI quarterly update and by the continued growth in industrial production and the ISM manufacturing index. Prior to the recession there was a reasonable correlation between industrial production and steel supply, though steel was very much more volatile in this comparison just as it is against GDP, (Fig 3). We have many indicators that suggest that steel supply is lower than it should be at this stage of a recovery but there has been a recent surge which we attribute to both strength in manufacturing and to growth in total construction which has been > 5 percent annualized for over two years. The gap between steel supply and the industrial production index is closing, but slowly, and it will in the 2017/2018 time frame before convergence. This is also when, as we have reported elsewhere, housing and non-residential at their present rates of growth will have recovered.