Market Data
September 19, 2014
Service Centers Essentially Eliminate Apparent Inventory Deficit
Written by Brett Linton
Steel Market Update nailed (in our opinion) last month’s forecast for August. We projected that the -193,000 tons deficit from the end of July (based on our proprietary formula for what a balanced flat rolled inventory level should be for the U.S. service centers) would be eliminated and move into a very small excess situation. This was due to an import adjustment that we made to inventory levels of 200,000 tons. The actual excess/deficit level for August was -9,000 tons which is pretty darn close to perfect when you are playing with large numbers.
Our new forecast is calculated using September 2013 through January 2014 figures, increasing daily shipments by 6 percent and inventory levels by 5 percent. We estimate that inventories will move further into an excess state throughout 2014. Note that we have added additional foreign tonnage to inventories for September, October and November by 200M, 150M and 100M, respectively. However, we believe there will need to be an inventory adjustment which would come out of domestic tonnages prior to the end of the year lead times (thus we will need to remove our domestic inventory growth levels probably in December). We will watch this carefully in the coming weeks.
An adjustment in domestic order patterns would probably result in downward pressure on spot pricing. We think there is a better than 50/50 odds that 2014 will return to normal 4th Quarter buying patterns when special price offers are made by the domestic mills to fill their Thanksgiving through New Year’s order books.
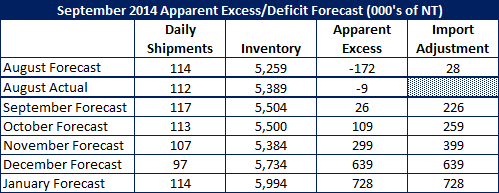
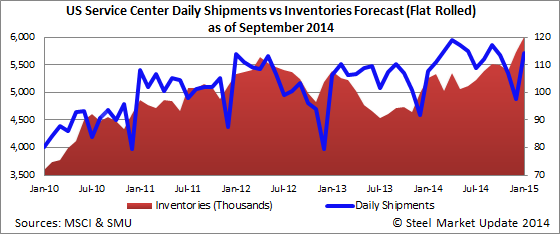
Below is a model showing our daily shipment forecast rates and inventory levels through January 2015.
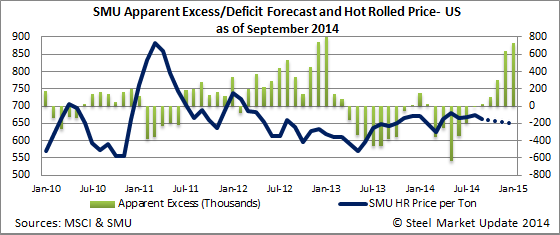
Below is a graphic showing our apparent excess model with a hot rolled price forecast overlay.