

Market Data

September 21, 2014
Steel Mill Lead Times Better Than This Time Last Year
Written by John Packard
Based on the results from our most recent Steel Market Update steel market analysis, flat rolled steel mill lead times, the number of weeks needed to produce and ship a new order, remained above 2013 levels on all products.
SMU conducted one of our twice monthly steel market surveys this past week. During the process we asked those responding to our online invitation to participate where they were seeing lead times for new orders placed with the domestic steel mills.
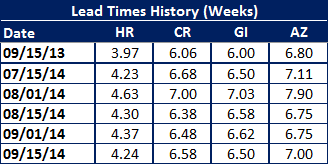
The participants, which are all either manufacturing companies or flat rolled steel service centers reported hot rolled lead times as remaining above 4 weeks (as an average) where they have been for most of this year. Last year at this time they were reported to average 3.97 weeks.
Cold rolled lead times averaged 6.58 weeks based on this week’s survey results which is approximately one half week longer than one year ago. Galvanized was in a similar situation with it hovering around the 6.50 week mark for four of the last five survey periods while last year it was measured at 6.00 weeks.
Galvalume lead times increased to 7.00 weeks which is close to the 6.80 weeks reported last year at this time.
The consistency of lead times has been one of the factors which has held prices relatively stable during calendar year 2014.
An interactive graphic can be seen below when you are reading the newsletter online. If you have not logged into the website in the past and need your username and password, contact us at: info@SteelMarketUpdate.com or by calling 800-432-3475. If you need help navigating the website we would also be very happy to assist you.
{amchart id=”112″ SMU Lead Times by Product- Survey}


