

Market Data
October 9, 2014
SMU Survey Results: Mill Lead Times Slip
Written by John Packard
On Monday of this week, SMU began our early October flat rolled steel market survey. Invitations were sent to approximately 600 companies across the United States and Canada. The survey was concluded earlier today (Thursday).
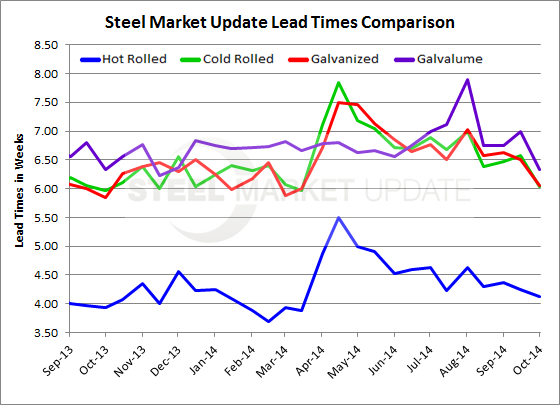
One of the key focus areas for the survey is to discover if there are any changes in lead times (the amount of time promised for production of new orders out of the domestic steel mills). We combine all of the responses to come up with an industry average and then compare our results with prior weeks to see if there are any changes which might suggest a change in the trend on hot rolled, cold rolled, galvanized or Galvalume products.
![]() Our results from this week’s survey indicated all of the products had reduced lead times compared to mid-September.
Our results from this week’s survey indicated all of the products had reduced lead times compared to mid-September.
The hot rolled lead time average dropped to 4.12 weeks from 4.24 weeks and is very close to the 3.94 weeks recorded at this time last year. The shortest lead time was reported 3.70 weeks which was measured in mid-February 2014. The longest we have seen HRC lead times was the 5.49 weeks recorded in mid-April 2014.
Cold rolled lead times dropped by half a week. CR lead times are now averaging 6.04 weeks vs. the 6.58 weeks reported in mid-September. As with HR, CR lead times are very close to the 5.96 weeks reported one year ago. The shortest lead time was in mid-March 2014 at 5.96 weeks (the same as one year ago). The longest we have measured CR lead times over the past 12 months was the 7.84 weeks in mid-April 2014.
Galvanized lead times also slipped by approximately half a week. The average for this week is 6.05 weeks down from the 6.50 weeks reported in mid-September. Last year lead times on GI were averaging 5.84 weeks. The shortest lead time for the past 12 months was reported on October 1, 2013 at 5.84 weeks while the longest being in mid-April at 7.49 weeks.
Galvalume continues to have the longest lead time of the four products (HR, CR, GI and AZ) averaging 6.33 weeks which is the same as one year ago. The 6.33 weeks is down from 7.00 weeks reported in mid-September. The shortest lead time on AZ was mid-November 2013 at 6.22 weeks and the most extended lead time we have recorded over the past 12 months was in the beginning of August 2014 at 7.90 weeks.
An interactive graphic can be seen below when you are reading the newsletter online. If you have not logged into the website in the past and need your username and password, contact us at: info@SteelMarketUpdate.com or by calling 800-432-3475. If you need help navigating the website we would also be very happy to assist you.
{amchart id=”112″ SMU Lead Times by Product- Survey}


