

Market Data
October 23, 2014
SMU Steel Buyers Sentiment Index: Still Optimistic
Written by John Packard
Steel buyers and sellers continue to be optimistic about their company’s ability to be successful in the current market conditions. However, there are some signs of strain growing, either due to seasonal pressures or margin squeezes, that may be giving pause to some within the industry. Even so, the results from the mid-October flat rolled steel market survey point toward continued optimism despite whatever pressures exist.
The SMU Steel Buyers Sentiment Index was measured this week at +59 which is 5 points lower than earlier this month and 9 points below the peak achieved in early August 2014. Sentiment is still well above the +38 reported during the middle of October 2013 and well within the optimistic range of our Index.
The three month moving average (3MMA) has come off the recent all time high of +61.83 and is now at a very optimistic +61.17. One year ago the 3MMA was +39.00.
What Our Respondents are Saying
“Market is slipping. Too many imports.” Service Center.
“Plate market seems to be holding up.” Service center.
“October typically our biggest month.” Metal Building Company.
“We are always slower during the holiday months.” Manufacturing company.
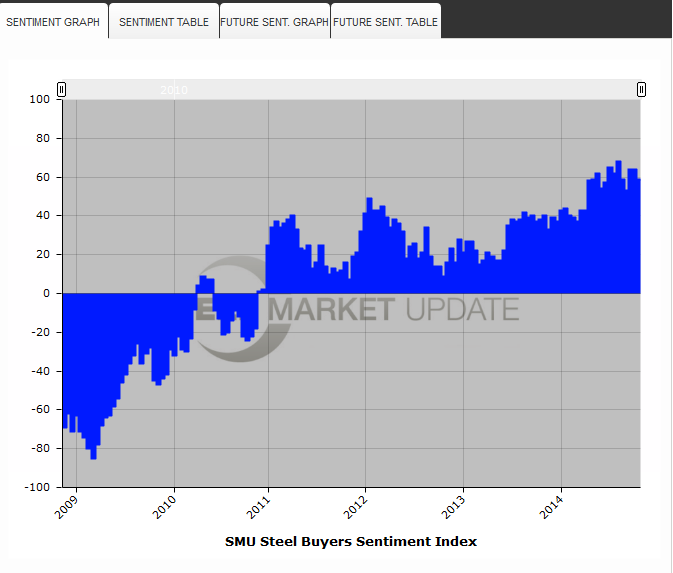
We thought it would be of interest to our readers to take a look at our Sentiment Index from a historical perspective. We first started measuring Sentiment on October 15, 2008 when Sentiment was reported as being -69. The -69 was not the lowest, or most pessimistic we have seen as we got a -85 reading in early March 2009. Remember, the most pessimistic reading possible is -100. (article continues below)
Since then, as you can see by the snapshot of our interactive graph from our website (available to all members including our free trials), we began to stair-step our way back into positive (optimistic) territory really gaining a foothold in early 2011 and refusing to return to pessimism attitudes. So far, 2014 has been the most optimistic year we have seen since we began our Index. with the highest reading of +68 having been achieved in August of this year. The most optimistic reading possible is +100.
SMU believes that we will see even greater optimism in the coming months and years as our “energy revolution” coupled with an new “industrial rennassaince” will lead to a strengthening labor and construction markets.
About the SMU Steel Buyers Sentiment Index
SMU Steel Buyers Sentiment Index is a measurement of the current attitude of buyers and sellers of flat rolled steel products in North America regarding how they feel about their company’s opportunity for success in today’s market. It is a proprietary product developed by Steel Market Update for the North American steel industry.
Positive readings will run from +10 to +100 and the arrow will point to the right hand side of the meter located on the Home Page of our website indicating a positive or optimistic sentiment.
Negative readings will run from -10 to -100 and the arrow will point to the left hand side of the meter on our website indicating negative or pessimistic sentiment.
A reading of “0” (+/- 10) indicates a neutral sentiment (or slightly optimistic or pessimistic) which is most likely an indicator of a shift occurring in the marketplace.
Readings are developed through Steel Market Update market surveys which are conducted twice per month. We display the index reading on a meter on the Home Page of our website for all to enjoy.
Currently, we send invitations to participate in our survey to almost 600 North American companies. Our normal response rate is approximately 110-170 companies. Of those responding to this week’s survey, 45 percent were manufacturing companies (unchanged from our last survey) and 42 percent were service centers/distributors (up 1 percent from our last survey). The balance of the respondents are made up of steel mills, trading companies and toll processors involved in the steel business.


