

Prices

December 14, 2014
Investigation of Steel Import License Data Accuracy
Written by Peter Wright
Steel import data is reported three times for each month. These reports are licensed, preliminary and final tonnages for each product. The Steel Import Monitoring system has been a widely used tool to provide an advanced look at import volumes using data compiled from import licenses. These licenses can be applied for at any time between when the vessel ships to ten days after it arrives, so there is not an exact overlap with a calendar month of receipts.
The total licensed tonnage for any product in a given month is available on the first Tuesday of the following month which is about three weeks before the preliminary numbers and about five weeks before the final numbers are released.
We decided to investigate the degree to which the license numbers for flat rolled products accurately predict the final volume throughout the course of 2014, expecting, that as the year progressed, the total license and final data for the year to date would converge. We first published this analysis using data for the first four months of 2014 and saw how close the preliminary and final numbers are. Sometimes they are identical over large volumes.
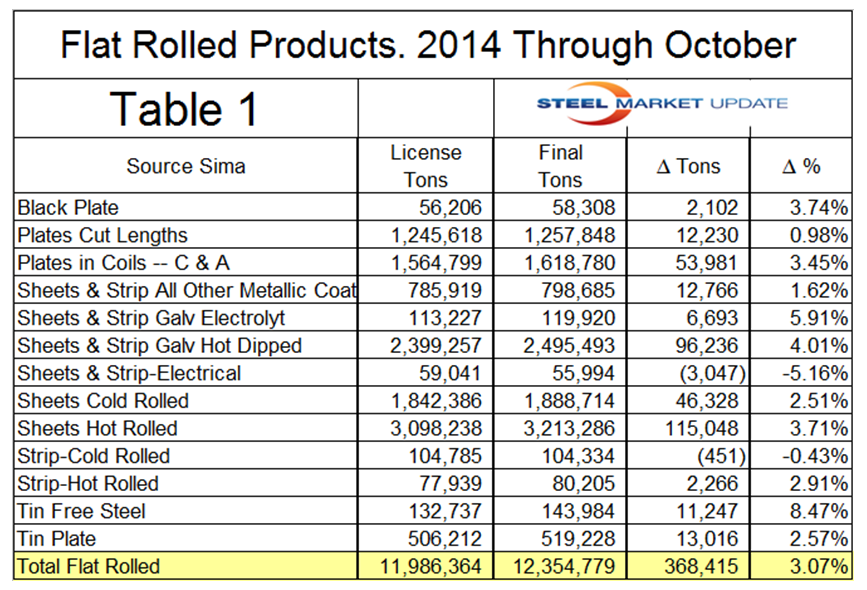
Moving on to examine the licensed data we saw that through April the total final tonnage of flat rolled products was 4.6 percent greater than the licensed volume. We have now updated this analysis twice, once through June and now through October. Through June and October the final tonnage was 3.79 percent and 3.07 percent respectively more than the licensed tonnage therefore as we expected the numbers are converging in the course of the year. We will perform this analysis one more time when December’s final volumes are released by which time it appears that the difference between final and licensed will be well below 3 percent.
Table 1 shows the difference between final and licensed tonnage by product for the first ten months of 2014. Of the big 3, hot rolled, cold rolled and HDG sheet, cold rolled has the smallest discrepancy at 2.51 percent followed by hot rolled at 3.71 and HDG at 4.01 percent. In all cases, except electrical sheet and strip and cold rolled strip, the discrepancy is positive, meaning that more arrived than was licensed. We assume that actual can be more than licenses because permits can be obtained after the steel has arrived in the US.
In a study such as this, the problem is that the date of the license can vary by weeks but the date of arrival is a fact. Our conclusion from this license accuracy investigation is that the ability of the licensed data to predict the final volume is good. This is important because in the import analysis performed by SMU for our Premium level members we use a three month moving average which includes the latest final, preliminary and licensed tonnage for three consecutive months and we perform this analysis in the first week of each month. So for example, in the first week of January our import analysis will include the December licensed data, the November preliminary data and the October final data.
We think this gives the fastest possible analysis and both evens out monthly noise and dilutes any inaccuracies in the licensed data. As this current investigation indicates, the licensed data is surprisingly accurate so we are happy about the methodology we are using.
This article was written by Peter Wright who is a contributing writer and steel industry expert. Peter is also one of our Steel 101 instructors.


