

Market Data

May 26, 2015
SMU Flat Rolled Steel Market Surveys
Written by John Packard
Twice per month, Steel Market Update (SMU) conducts a detailed flat rolled steel market analysis. We do this by inviting approximately 600 companies, which have been vetted by our publisher to make sure they are legitimate buyers, sellers or executives involved with hot rolled, cold rolled, galvanized, Galvalume or plate products. We then send invitations to participate in a two-pronged questionnaire.
In any one survey we receive anywhere from 110 to 160 responses. Of those responding this past week 48 percent were from the manufacturing segment of the industry and 40 percent from service centers/wholesalers. From there our survey respondents drop down to 6 percent trading companies, 4 percent steel mills and 2 percent toll processors.
The first portion of our survey consists of general questions for the entire group. It is from here that we derive our Current and Future Sentiment Indices.
It is here that we also take our first look at steel demand. We ask all of the respondents if, in their opinion, demand for their products is: improving, remains the same or is in decline.
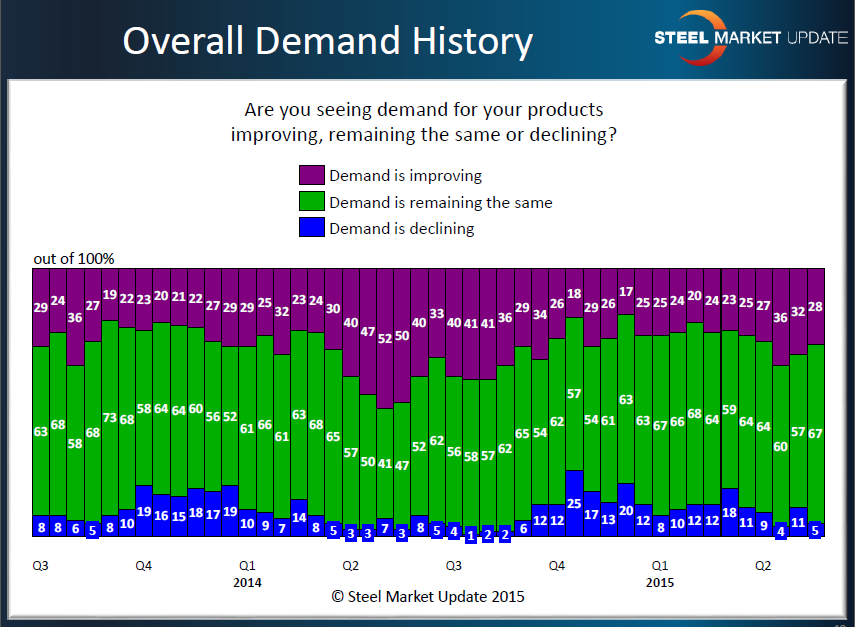
The graphic above is one of two that we share with those who take our survey as well as our Premium level subscribers.
Our respondents continue to point toward either a balanced demand scenario (67 percent) with 28 percent reporting growing demand and only 5 percent reporting demand as in decline. We will test demand again once we move into the segmented phase of our survey.
We also use the general section of our questionnaire to ask questions about current topics of interest. In the case of the last two surveys we have been probing about whether the domestic steel mills will be able to create enough momentum in order to collect a second price increase. Only 36 percent of our respondents were believers in a second successful price increase.
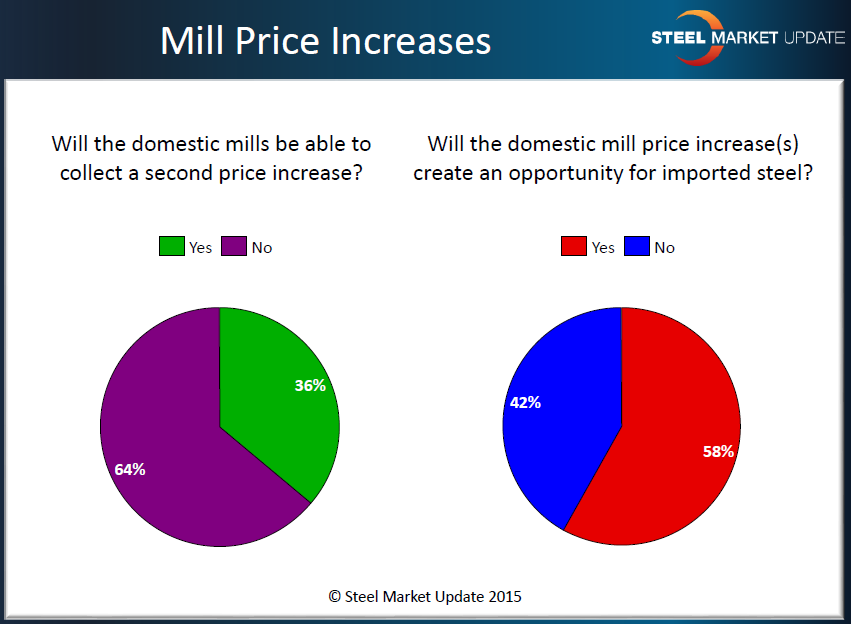
At the same time, we wanted to know if the mill price increases were creating an opportunity for more foreign steel and we found that a majority of our respondents (58 percent) believe that the price increases will encourage more foreign steel to U.S. shores.
From this point we break out our respondents into their various market segments. Each segment receives their own specific questions and today we are going to report on a number of the questions which do not make it into our articles on a regular basis but are available for both our Premium members and those who take the time to complete our questionnaire.
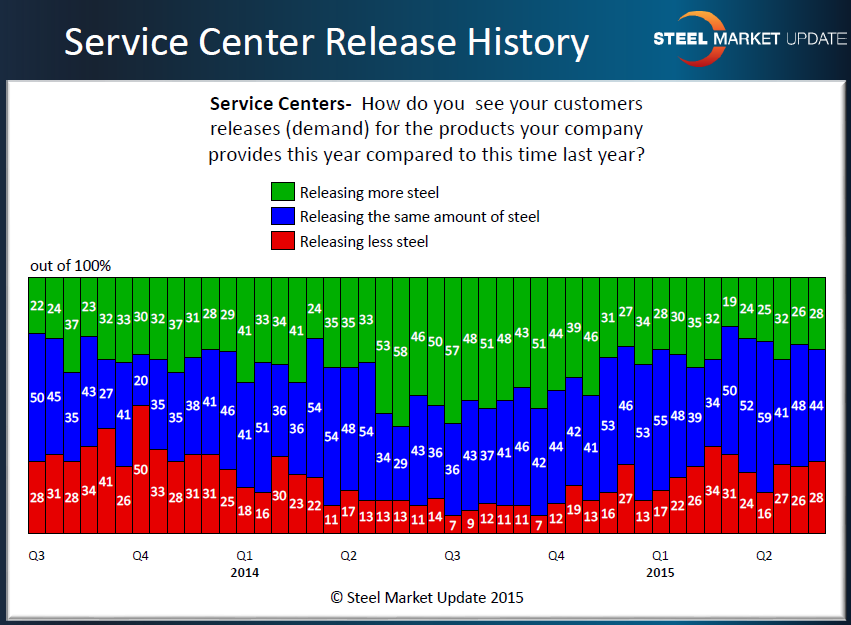
First, however, we want to return to our question about demand and how demand compares to this time last year. We asked the service centers/wholesalers how demand, as represented by their customer releases, compares to one year ago. We believe the graphic (below) says it all. Compare what we were collecting for responses on the same question during 2nd Quarter 2014 vs. 2015. Those reporting their customers as releasing less steel has doubled compared to one year ago and those who are reporting their customers as releasing more steel has been halved.
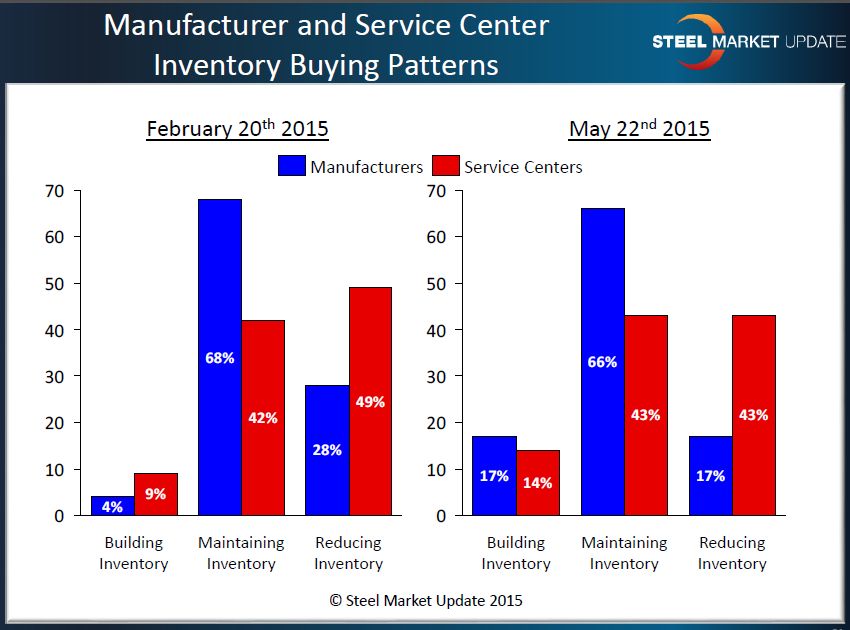
When we started producing our flat rolled market analysis one of the first items we asked was directed at manufacturing companies and service centers. We have been asking from the beginning about inventory buying patterns. What we have been interested in learning more about is whether inventories are balanced or need adjusting. When inventories need adjusting that puts pressure on the mill order books and pricing.
We also want to compare service centers with manufacturing companies because we have seen times when one is balanced while the other may be either building or reducing depend on the situation.
In the analysis we did this past week we are continuing to see a large percentage of service centers reporting that they are reducing inventories (43 percent, down from the 49 percent measured in our mid-February analysis and well below the 66 percent measured at the beginning of March 2015). So, our survey results are showing a marked improvement on behalf of the service centers but still a long way from the 7 percent measured during the 1st week of April 2014.
Manufacturing companies, on the other hand, had just as many reporting inventories as being reduced as those reporting building. Manufacturing companies appear to have balanced inventories as a group.
One of the reasons why we focus so much attention of manufacturing companies and the distributors is that they don’t look at the steel world through the same pair of lenses. One of the areas in the survey done this past week was regarding mill lead times. As you can see by the results posted in the graphic below, service centers are reporting more play in lead times than what we are seeing out of the manufacturing companies.
As our survey respondents know, as well as our Premium members, we do show the history to both so they can get information in context and not with just snapshots in time.
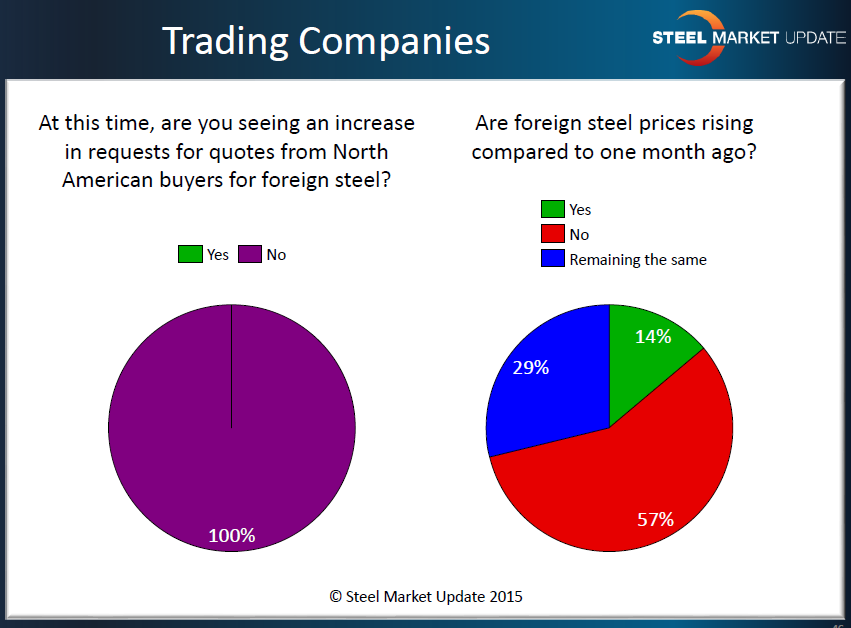
We generally don’t report on the data we have been collecting from other market segments since the number of respondents are more limited compared to our two major groups. Even so, we do gather information that gives us information about the industry. A good example is in the graphic below of a couple of the responses we got from our trading company respondents. Even with the recent price increase out of the domestic mills, the trading companies are reporting that their requests for quotes have not increased. Also, at the same time we got mixed results regarding foreign steel pricing. This is something that leads us to probe further to see what we can find out.
This is but a short glimpse into a portion of the analysis we go through twice a month. For those of you who would like to learn more and see the detailed results of one of our surveys you can do so in two ways: 1) become a survey respondent or, 2) become a Premium level subscriber. In both cases you can request more information by sending an email to: info@SteelMarketUpdate.com.


