Market Data

May 30, 2015
May 2015 Steel Data at a Glance
Written by John Packard
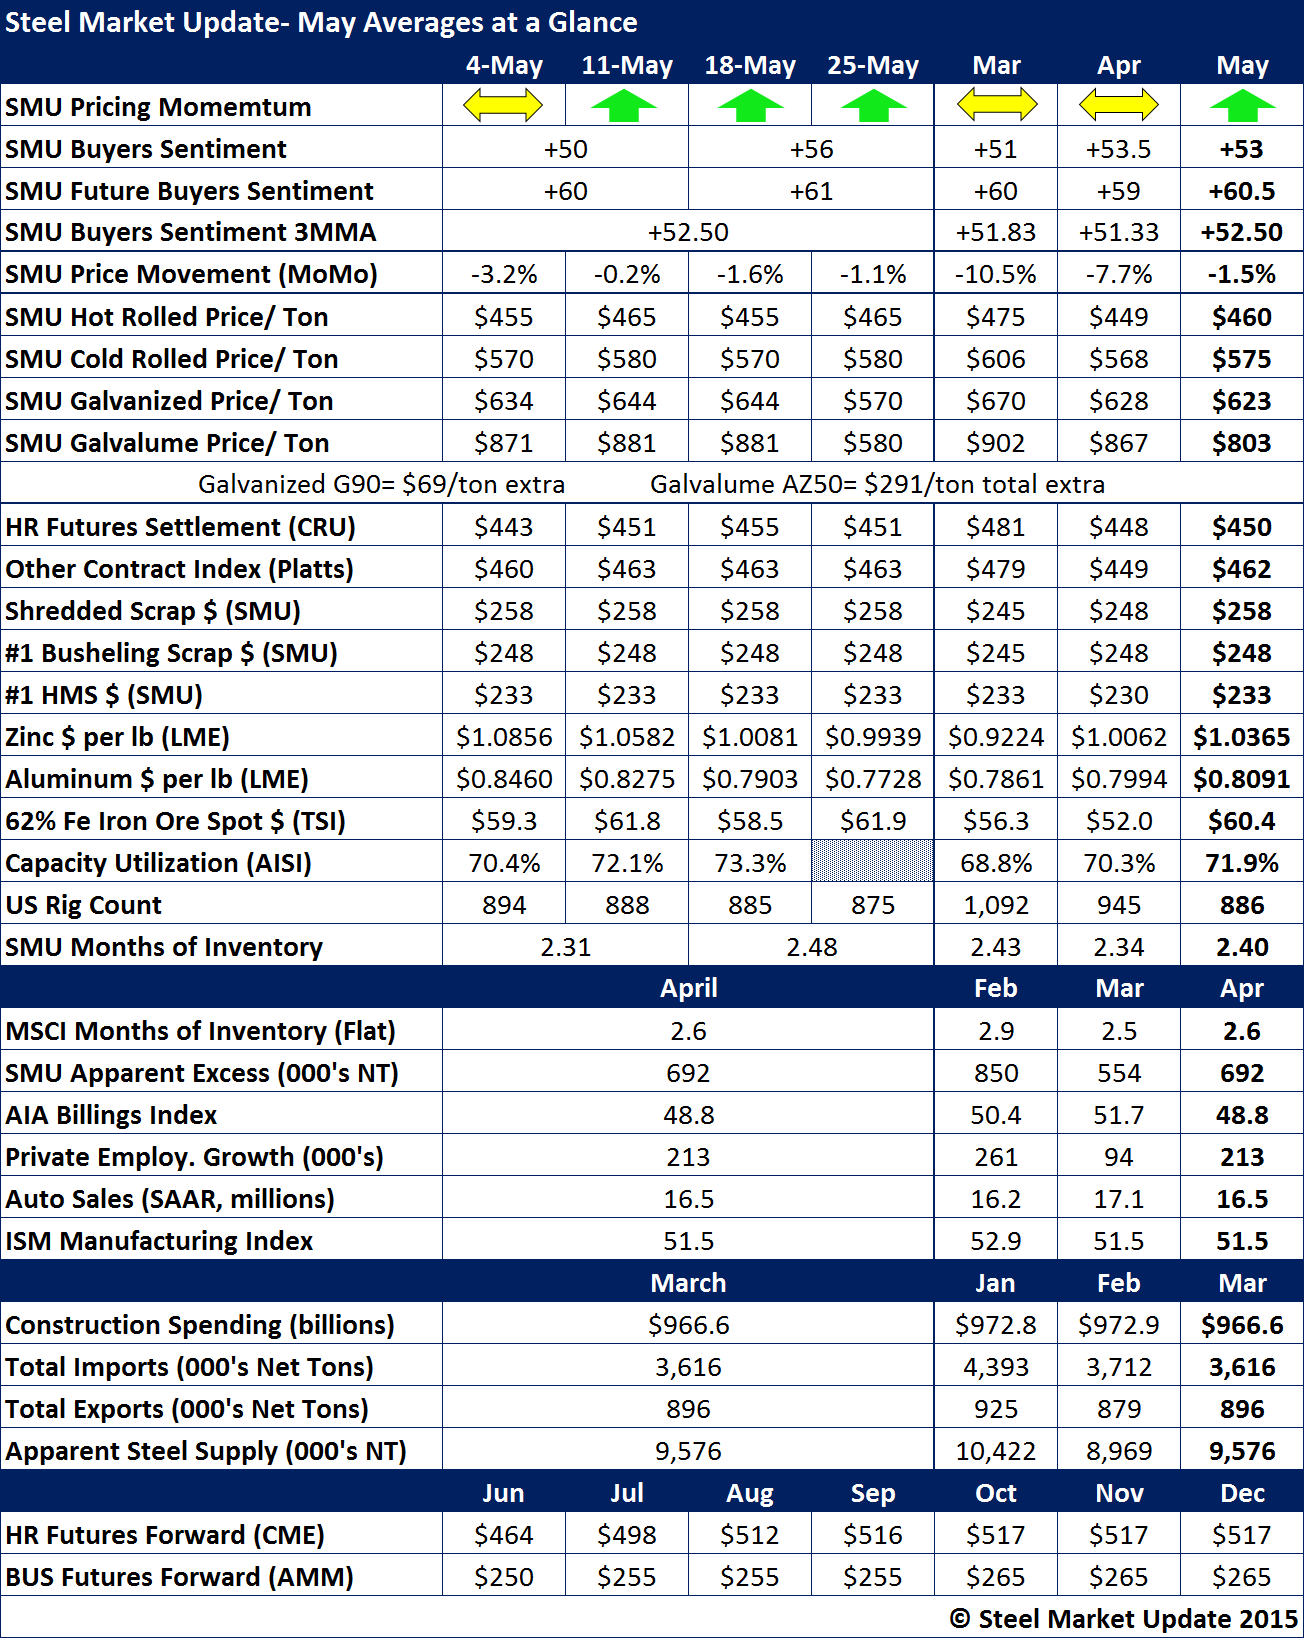
We ended the month of April with the SMU Price Momentum Indicator at Neutral. As the month of May began, the domestic mills announced price increases and managed to move our needle to Higher. As the month ends, our Momentum Indicator continues to point toward higher domestic flat rolled steel prices over the next 30 days.
SMU Steel Buyers Sentiment Indices continues to be well ensconced within the optimistic range of our indexes (both Current Sentiment and Future Sentiment).
SMU hot rolled price average for the month of May was $460 per ton, $10 per ton higher than CRU and $2 per ton lower than Platts.
Cold rolled prices averaged $575 per ton, galvanized .060” G90 at $623 per ton and .0142” AZ50, Grade 80 at $803 per ton.
Zinc prices actually fell from the beginning of the month ($1.0856 per pound) ending the month at just under $1.00 per pound ($0.9939 per pound).
Aluminum, used in Galvalume, ZAM and aluminized also dropped during the month. Aluminum began the month at $0.8460 per pound and ended the month at $0.7728 per pound.
One of the interesting pieces of data is rig counts. Take a look at the table below and notice how rig count went from 1,092 rigs in March, 945 in June and the average for May was 886.
MSCI flat rolled months of inventory disappointed and ended the month of April (May has not been announced yet) at 2.6 months. This took our Apparent Excess up instead of the projected down we predicted one month earlier. The Apparent Excess is now 692,000 tons.
Total steel imports were down slightly over the prior month but the 3.6 million net tons is still way too high for the domestic mills to gain from any improvements in manufacturing.
The Futures markets (CME) are calling for hot rolled prices to increase into the low $500’s as we getinto August and beyond.