SMU Data and Models
Lead Times: Waiting
Written by John Packard
June 7, 2015
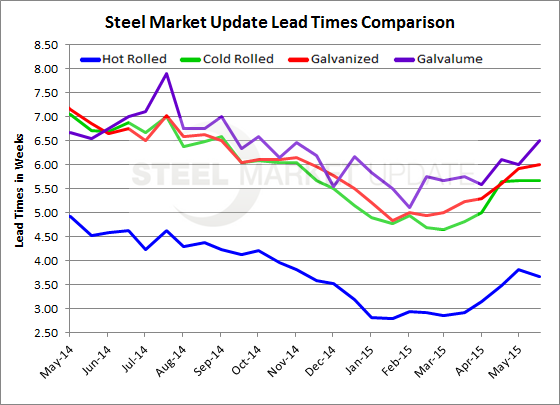
Lead times have not shot out since the price increase announcements were made in early May. Hot rolled lead times were reported as being 3.5 weeks at the beginning of May and one month later HRC lead times averaged 3.66 weeks according to the results of our most recent flat rolled steel survey. Lead times on HRC are better than the 2.86 weeks average we saw back in mid-March but are below the 4.5 weeks we saw at this point in the year this time last year.
Cold rolled lead times are stalled at just over 5.5 weeks over the last three survey periods (early May, mid-May and now early June). CRC lead times are improved over the 4.64 weeks we saw in mid-March but we are still a week shorter this year than at this point in time last year.
Galvanized lead times are now at 6.0 weeks average based on our survey respondents from last week and are now one week longer than what we saw mid-March. As with HRC and CRC, galvanized lead times are still almost one week shorter than this time last year.
The one product that did show some signs of life is Galvalume were lead times are now at 6.5 weeks which is one half week better than what we saw in our two May surveys. It is also equal to what we measured AZ lead times as being one year ago.
With the anti-dumping trade suit having been filed on coated products after our survey had begun we will be very interested in seeing if lead times move off what we are currently seeing. Our expectation is that there should be some movement as buyers adjust to the new realities of world trade in the United States.
John Packard
Read more from John PackardLatest in SMU Data and Models
Steelmaking raw material prices trend higher in October
Steelmaking raw material prices strengthened for all but one product in October, a change in pace compared to recent months, according to SMU’s latest analysis.
Apparent steel supply eases in August
The volume of finished steel entering the US market declined in August from July, according to SMU’s analysis of data from the US Department of Commerce and the American Iron and Steel Institute (AISI). Referred to as ‘apparent steel supply,’ we calculate this monthly rate by combining domestic steel mill shipments and finished US steel imports and deducting total US steel exports.
September service center shipments and inventories report
Flat rolled = 60.8 shipping days of supply Plate = 52.7 shipping days of supply Flat rolled Flat-rolled steel supply at US service centers declined in September, though still seasonally high. September’s report reflects lower demand, stable lead times, and restocking early in the third quarter at a perceived bottom in prices. At the end […]
SMU market survey results now available
SMU’s latest steel buyers market survey results are now available on our website to all premium members. After logging in at steelmarketupdate.com, visit the pricing and analysis tab and look under the “survey results” section for “latest survey results.” Past survey results are also available under that selection. If you need help accessing the survey results, or if […]
SMU survey: Steel Buyers’ Sentiment Indices diverge
SMU’s Steel Buyers’ Sentiment Indices moved in different directions this week. Our Current Steel Buyers’ Sentiment Index eased to a six-week low, while Future Buyers’ Sentiment ticked up to a four-week high. Both of our Indices continue to indicate optimism among steel buyers.