

Market Data

June 22, 2015
Currency Update for Steel Trading Nations
Written by Peter Wright
The big picture is as follows: from the 2015 Article IV Consultation with the United States of America Concluding Statement of the IMF Mission May 28, 2015 (heavily abridged by SMU).
“At current levels of the real exchange rate, the U.S. dollar is assessed to be moderately overvalued. As a result, the current account deficit is expected to move further away from medium-term fundamentals, to more than 3 percent of GDP over the medium-term. The stronger dollar is impacting U.S. growth and job creation, as well as weighing on inflation. Higher U.S. interest rates could still result in a significant and abrupt rebalancing of international portfolios with market volatility and financial stability consequences that go well beyond U.S. borders. There is a strong case for waiting to raise rates until there are more tangible signs of wage or price inflation than are currently evident. “
As expected the June FOMC meeting that took place last week made no change to the federal funds rate but suggested that the first rate hike is approaching. September is now seen as the most likely by most forecasters, as the Fed noted the recent improvement in economic data and awaits further improvement in the labor market and confirmation that the first quarter’s GDP weakness was short lived. According to the Summary of Economic Projections, only 2 out of the 17 participants felt that it would not be appropriate to raise the Fed funds rate this year. If there is an increase in September, there is much uncertainty about what happens next. FOMC participants are divided. Of the 15 who expect rates to increase this year, there is an even three-way split between those expecting a 25, 50 or 75 basis point increase by December. And there is a range of almost 200 basis points between forecasts for the Fed funds rate in 2017.
Any increase in US interest rates has to be viewed in the context of the quantitative easing being practiced by the major trading partners of the US. These forces will combine to escalate the value of the US dollar.
Our last analysis of the value of the US $ against the currencies of the steel trading nations was dated May 31st at which time the dollar was making another strong move upward. At that time every one of the steel trading currencies had strengthened against the US $ in the previous seven days. As of today’s date, June 22nd the situation has reversed with every one of these currencies except Ukraine having weakened in the previous seven days. This is the most extreme case of volatility that we have seen since we began these reports in June 2013.
As we prepare this analysis one of the problems we have is the timing of data from our two main sources. The Fed reports a daily nominal, (non-inflation adjusted) index, the latest data for which is June 12th but our source for individual national currency values, Oanda, is current as of today so is 10 days more up to date than the Feds. The result is that we often see trends in the individual currency values before the Fed has caught up. That is clearly the case with this June 22nd update. On June 12th the value of the US $ according to the Fed’s daily index was 114.9009 down by 1.0 percent in the previous 7 days. On March 13th the daily index peaked at 117.92, the highest value since May 13th 2004. Figure 1 shows the history of the daily BI since January 2013.
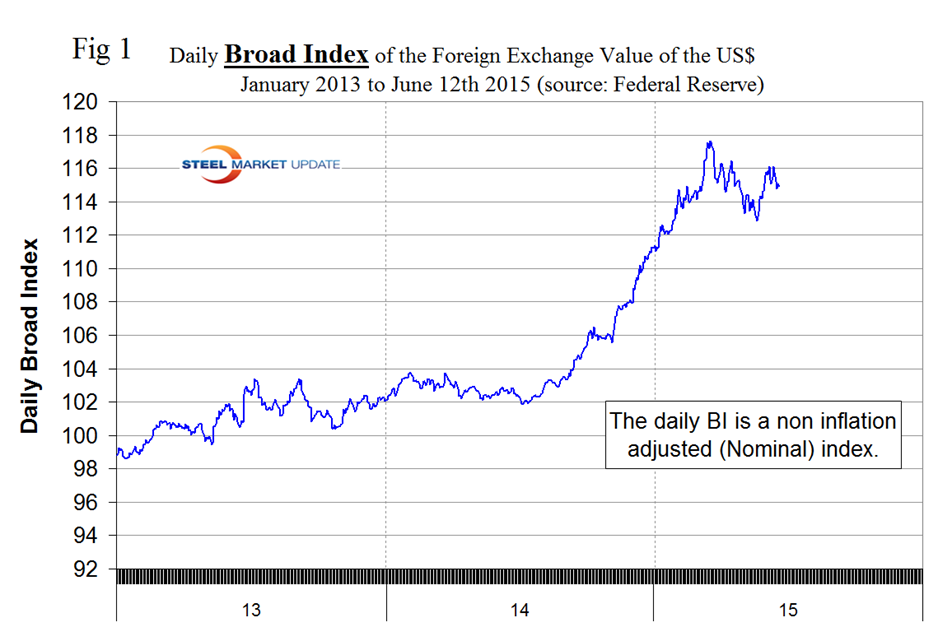
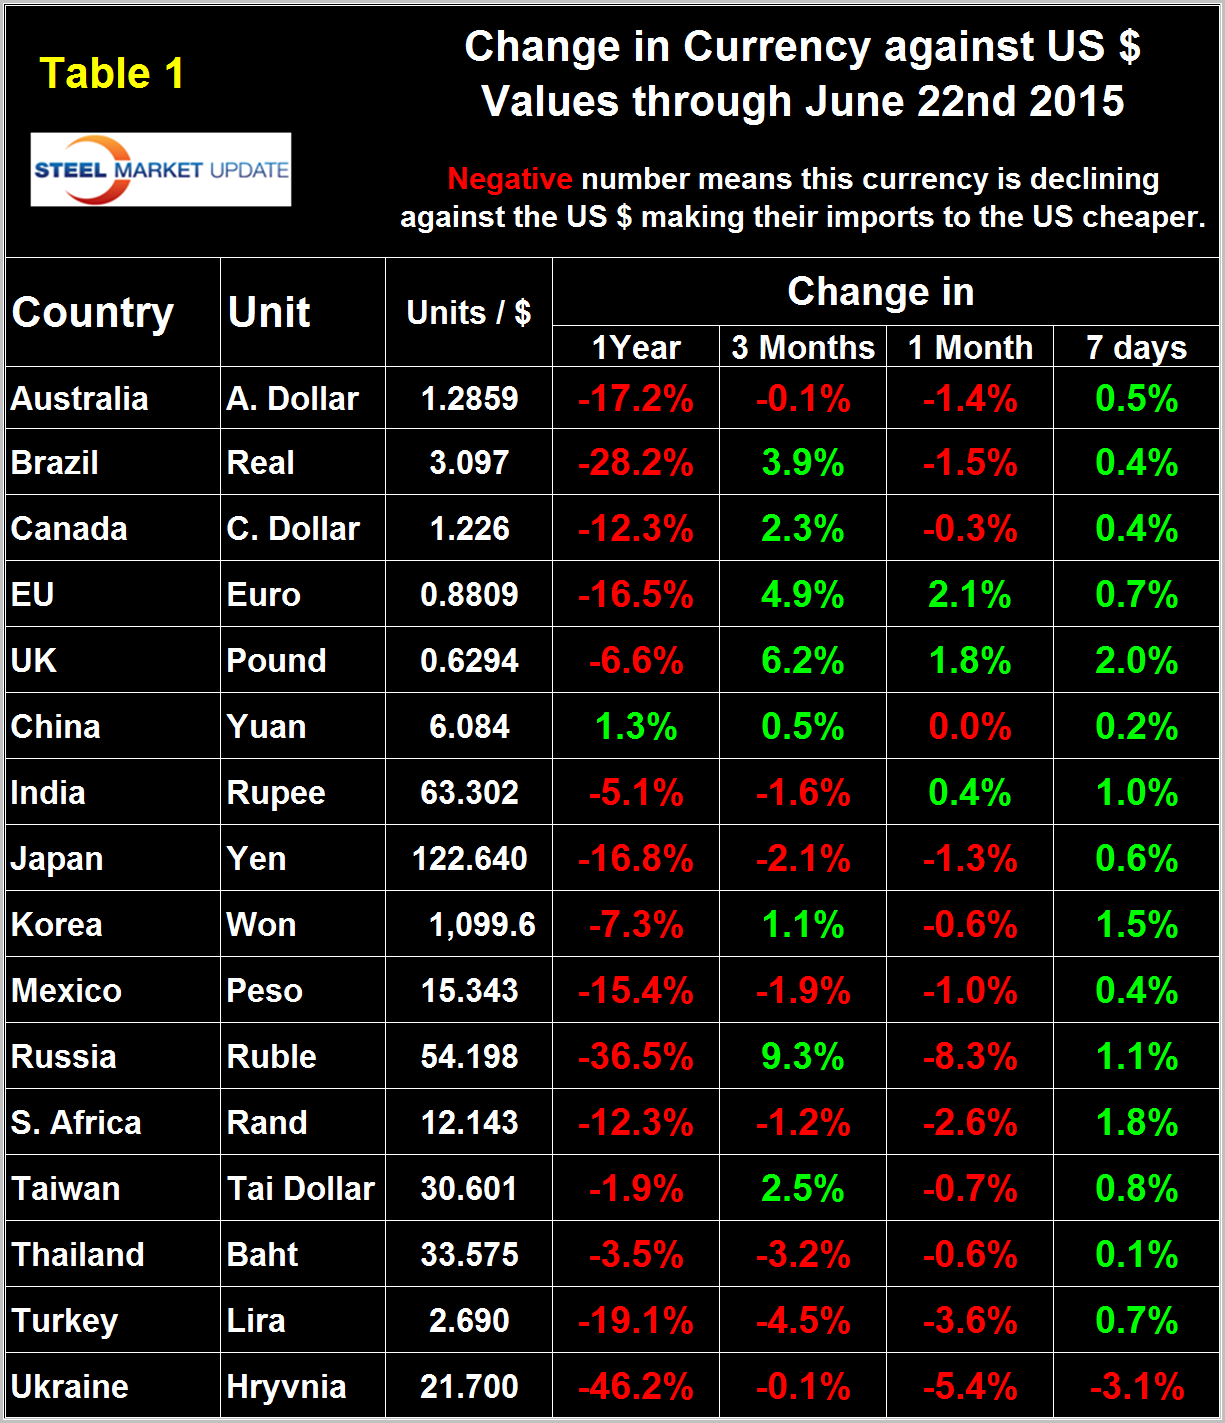
We normally prefer to show a longer time frame than this but doing so at present would lose the dramatic short term detail. After March 13th the nominal daily index declined to 112.84 on May 15th before recovering to 116.11 on June 5th then declining again to 114.9 on June 12th. Our daily currency data for the steel trading nations is obtained from the Oanda Forex trading platform which is described at the end of this report. As mentioned above, today’s Oanda data reports that 15 of 16 steel trading currencies went up in the last seven days. It does not necessarily follow that the currencies of the steel trading nations follow the Broad Index for two reasons. First the timing is different but also our 16 currencies are only a subset of those that go into the BI therefore can have a mind of their own. Table 1 shows the number of currency units of steel trading nations that it takes to buy one US dollar and the change in one year, three months, one month and seven days. The table is color coded to indicate strengthening of the dollar in red and weakening in green. We regard strengthening of the US Dollar as negative and weakening as positive because the effect on net imports.
In 2014, 25 percent of the U.S. economy was related to international trade therefore currency swings can have a huge effects on the economy in general and of the steel industry in particular. Earlier this month, the U.S. House of Representatives approved the Customs Bill in a 240-190 vote. The decision has been termed as a “tremendous win for the steel industry” by the American Iron and Steel Institute, and could prove to be just that. The legislation seeks to expand the definition of injury, thereby making it easier for companies operating in the U.S. steel sector to win trade cases.
To dramatize the change in the short term currency direction for the steel trading nations we have included here the currency table that we published on May 31st just three weeks ago, (Table 1 from May 31st.)
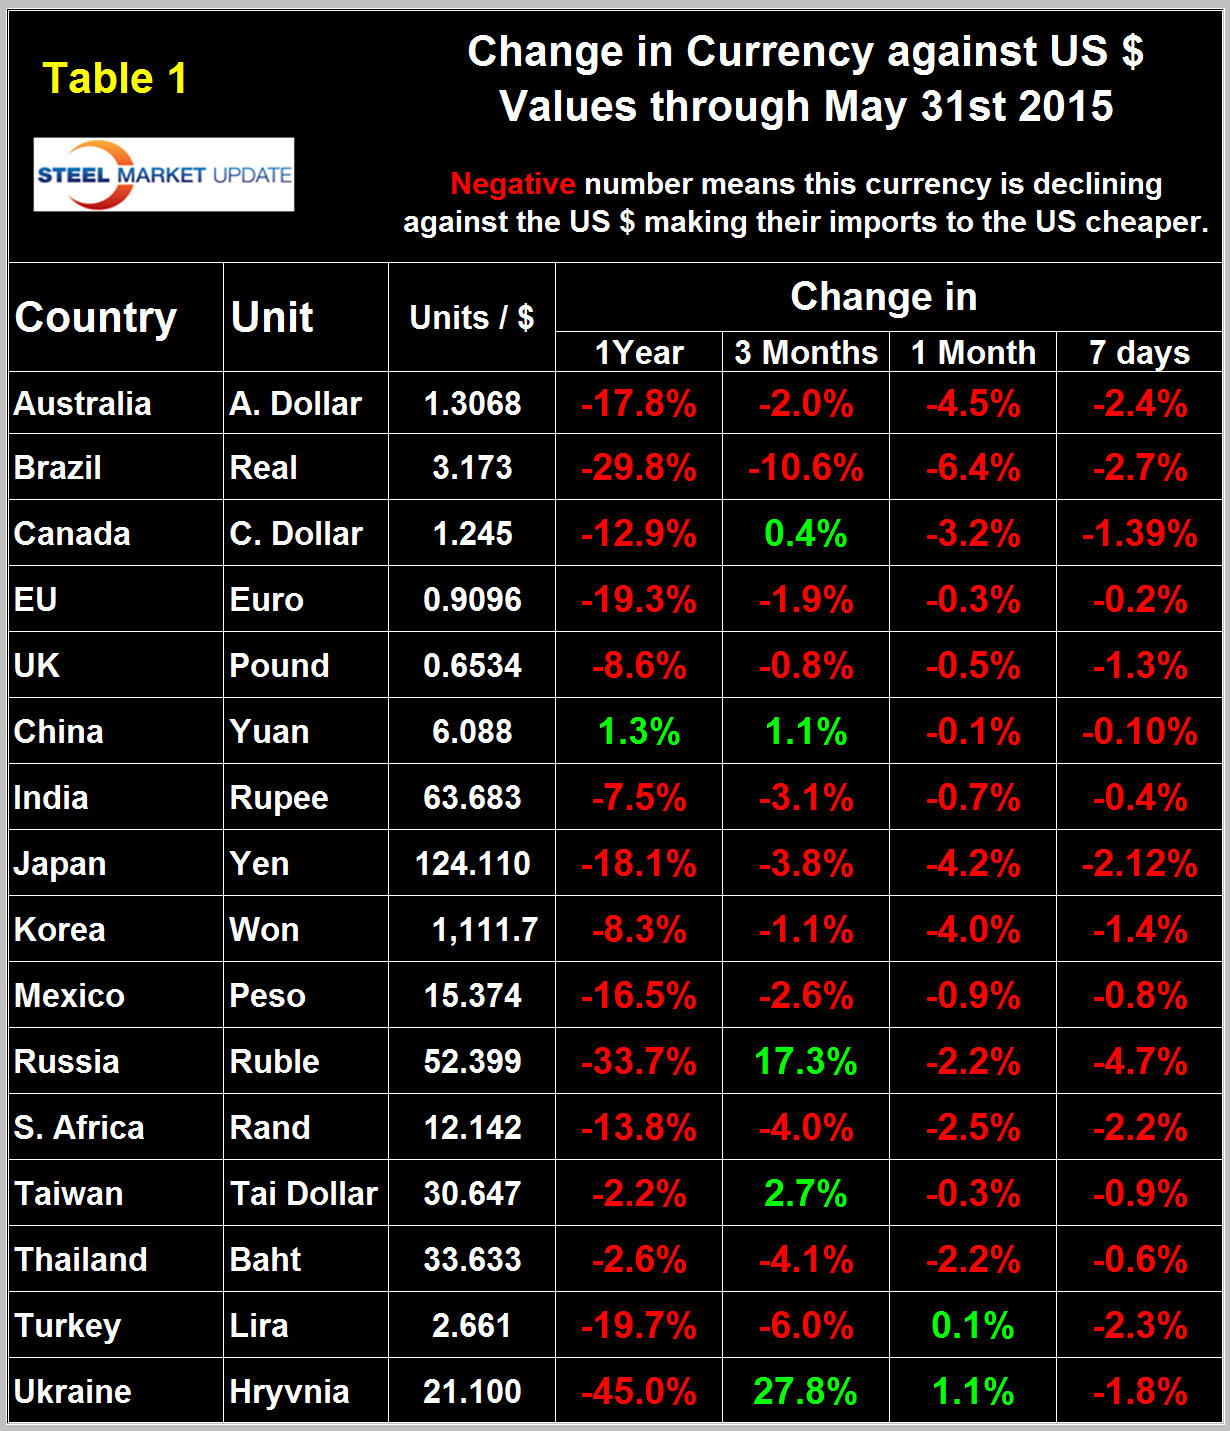
At the one month level 14 of the 16 currencies were red (declining) on May 31st, today that number is 13 and when we repeat this analysis in early July we expect there will be more green at the one month level. At the 12 month level only the Chinese Yuan has strengthened against the dollar in each of the last five updates. The dollar has strengthened against all other currencies five reports in a row.
At SMU we continue to regard the saga of the Euro as having the most significant future impact on the US steel industry. On September 6th last year the Euro broke through the 1.3 US $/Euro level for the first time since July 11th 2013, on January 6th it broke through 1.20 and through 1.10 on March 7th. It has strengthened erratically to 1.1352 on June 22nd, (Figure 2).
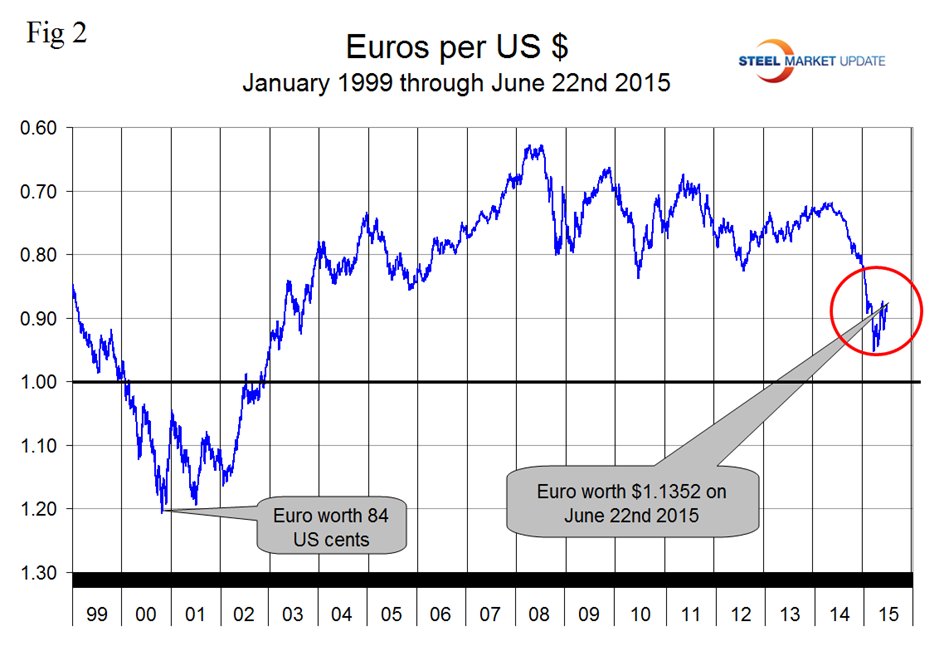
The yield on 10-year German government bonds broke above 1 percent on June 10th for the first time since September 2014 amid a broader global bond sell-off that’s been deepening since late April. The renewed ascent for German yields started last week when ECB President Mario Draghi said investors should get used to periods of higher bond market volatility and stated the central bank wouldn’t do anything about it. U.S. 10-year yield +6 bps to 2.48 percent. The Euro has declined by 16.5 percent against the $ in the last year but has clawed back 2.1 percent in the last month.
The Russian Ruble strengthened to less than 50 to the dollar on May 14th but has since slid back to 54.2 on June 22nd. The Ruble had declined to slightly less than 70 to the US $ on February 1st, (Figure 3).
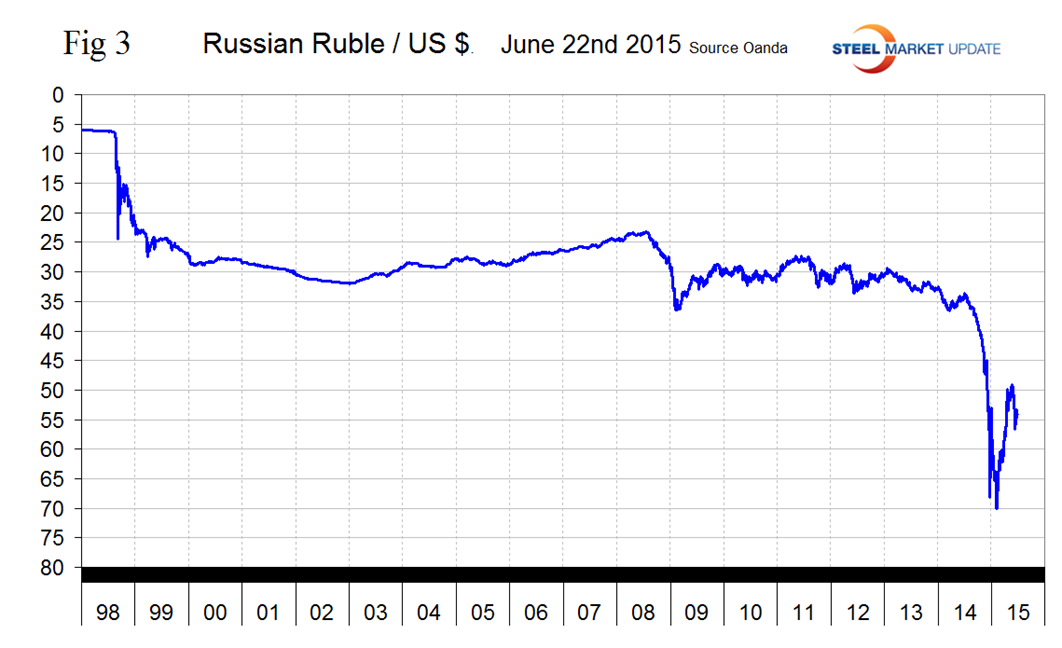
As it stands now the Ruble has declined by 36.5 percent against the dollar in 12 months and by 8.3 percent in the last month. In the last 7 days the Ruble has strengthened by 1.1 percent. As Russia’s economy has deteriorated, consumer demand significantly declined. Violence with Ukraine and sanctions from the West have severely weakened economic output, leading to increased unemployment. Moreover, as its currency fell, inflation measures spiked, diminishing consumers’ purchasing power. With the amount of economic uncertainty in Russia currently, its currency is likely to weaken in coming months. Yesterday the EU announced that it would continue the sanctions regime against Russia.
The Japanese Yen broke through the 120 level on December 6th and traded more or less sideways until May 21st when it resumed its decline, closing at 122.64 on June 22nd, (Figure 4).
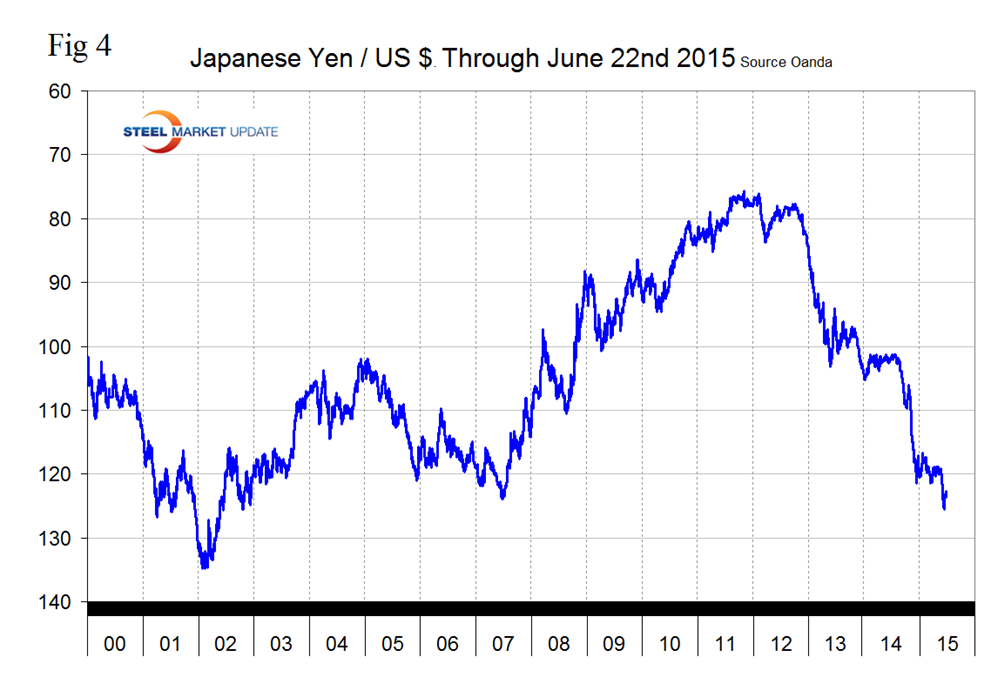
Depreciation against the dollar has been 16.8 percent in 12 months and by 1.3 percent in one month. The yen is headed for its biggest gain against the dollar this year after Bank of Japan Governor Haruhiko Kuroda said it’s hard to see the currency’s real effective rate falling further. According to BOJ data, the real effective exchange rate, which adjusts for inflation and trade with other nations, shows the Yen near its weakest level since early 1973. Currency traders reacted immediately to Kuroda’s remarks, shooting the Yen up 1.4 percent to 122.69 per dollar. It reached a 13-year low of 125.86 on June 5. As widely expected, the Bank of Japan maintained its massive stimulus program on June 17th, keeping intact its pledge to increase base money at an annual pace of ¥80T through aggressive asset purchases. At a press conference following the announcement, BOJ Governor Haruhiko Kuroda reiterated his expectations for consumer inflation to hit the BOJ’s 2 percent target around April to September 2016, a time-frame many analysts believe is too optimistic.
The Turkish Lira has been plunging for the last 12 months after a six month strengthening period in the first half of last year, (Figure 5).
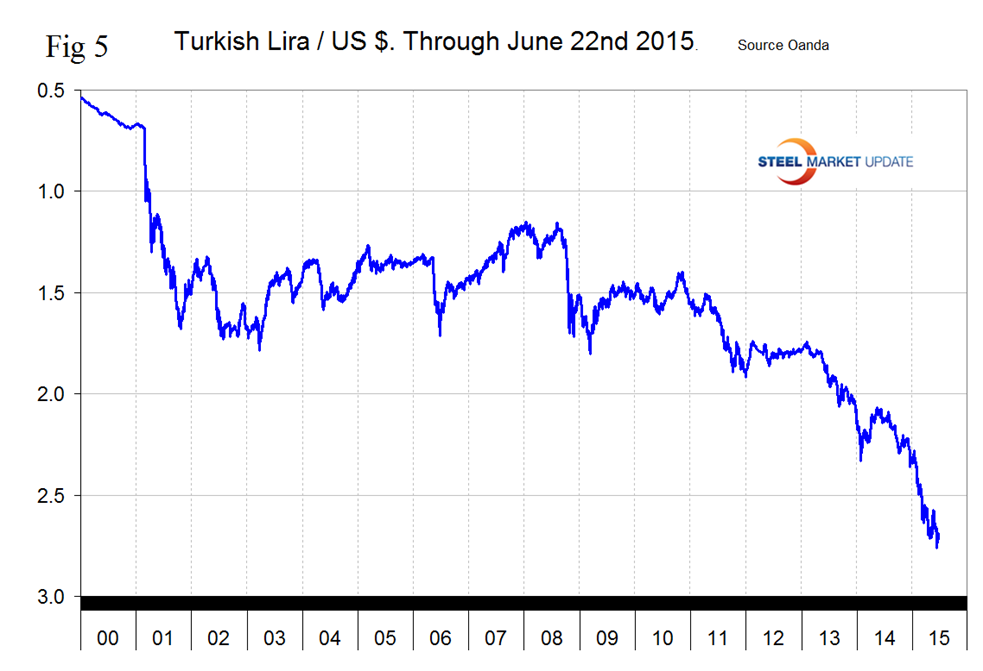
In the last 12 months the Lira is down by 19.1 percent and by 3.6 percent in the last month. Turkey’s economy is gradually weakening. Consumer spending continues to grow, while exports are contracting. Additionally, political strife in the country, due to recent elections, could weigh on investor sentiment. Until a turnaround in Turkey’s economy takes place, its currency should continue to weaken.
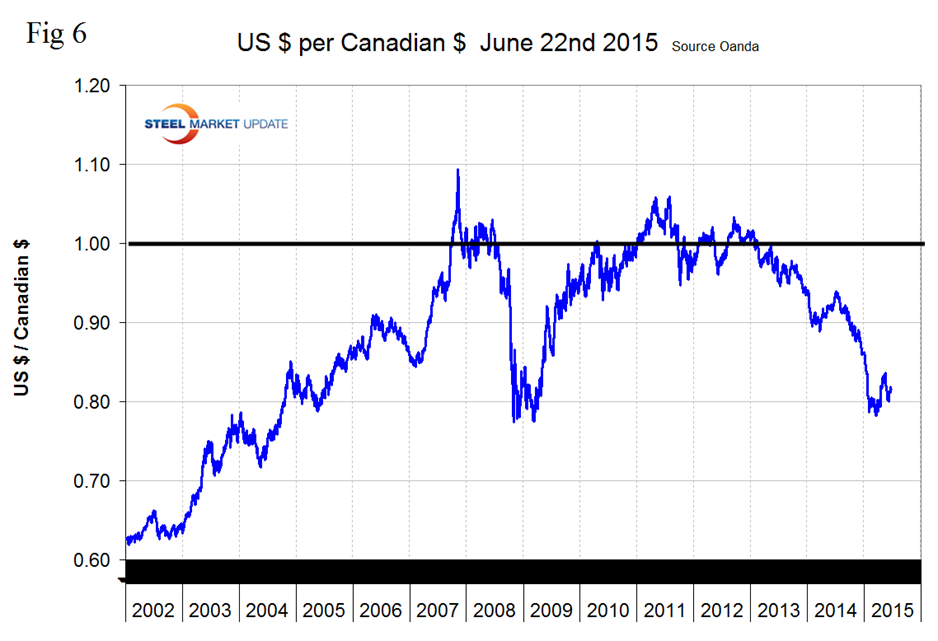
The Canadian $ has declined by 12.3 percent in the last twelve months. In the last three months it regained 2.3 percent but gave back 0.3 percent in the last month, (Figure 6).
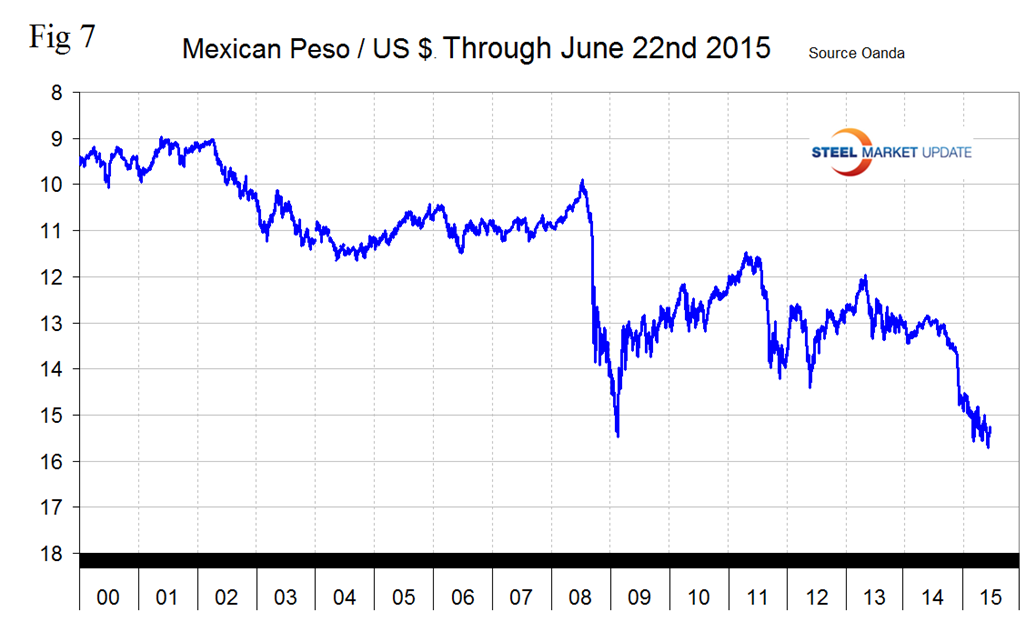
The Mexican Peso declined abruptly at the end of last year and more steadily ever since, (Figure 7). The peso is down by 15.4 percent in 12 months and by 1.0 percent in the last month.
SMU Comment: In this analysis we report on the currencies that we think have the most immediate significance, but all 16 steel trading nation graphs are available on request if any reader has a special interest that we haven’t covered. The dollar weakened in the last seven days but we don’t expect that to be the beginning of a trend. The probability of a yield increase for US treasuries coupled with quantitative easing elsewhere will drive the dollar value upward. This is not good for US steel producer competitiveness. The currency trends will continue to attract imports and suppress both exports and raw materials prices.
Explanation of Data Sources: The broad index is published by the Federal Reserve on both a daily and monthly basis. It is a weighted average of the foreign exchange values of the U.S. dollar against the currencies of a large group of major U.S. trading partners. The index weights, which change over time, are derived from U.S. export shares and from U.S. and foreign import shares. The data are noon buying rates in New York for cable transfers payable in the listed currencies. At SMU we use the historical exchange rates published in the Oanda Forex trading platform to track the currency value of the US $ against that of sixteen steel trading nations. Oanda operates within the guidelines of six major regulatory authorities around the world and provides access to over 70 currency pairs. Approximately $4 trillion US $ are traded every day on foreign exchange markets.


