

Market Data

July 15, 2015
Currency Update for Steel Trading Nations
Written by Peter Wright
We have two data sources for this report. These are the Federal Reserve and the Oanda forex trading platform. An explanation of these sources is given at the end of this report. Oanda is current every day but the Federal Reserve daily broad index (BI) is normally about eight days in arrears. This month the Fed’s latest daily update was June 19th which is unusually late and given the recent volatility in the currency markets this makes the BI of limited value. However for the sake of standardization of these reports we include our analysis of the BI here in Figure 1.
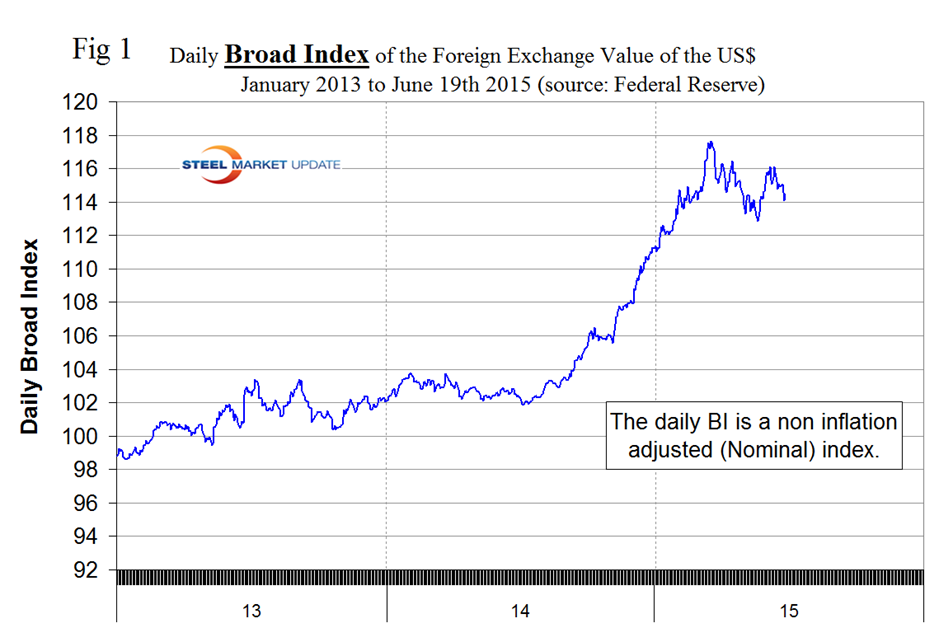
Through June 19th the value of the US dollar as recorded by the daily BI weakened in 3 months, 1 month and in 7 days. This contrasts with the Oanda reports for the 16 steel trading nations that we follow in this report. It does not necessarily follow that the steel trading currencies follow the BI and that is the case today. In the last 3 months, 1 month and 7 days through July 13th the US $ strengthened against 11, 11 and 13 of the 16 steel trading currencies respectively.
Table 1 shows the number of currency units of steel trading nations that it takes to buy one US dollar and the change in one year, three months, one month and seven days.
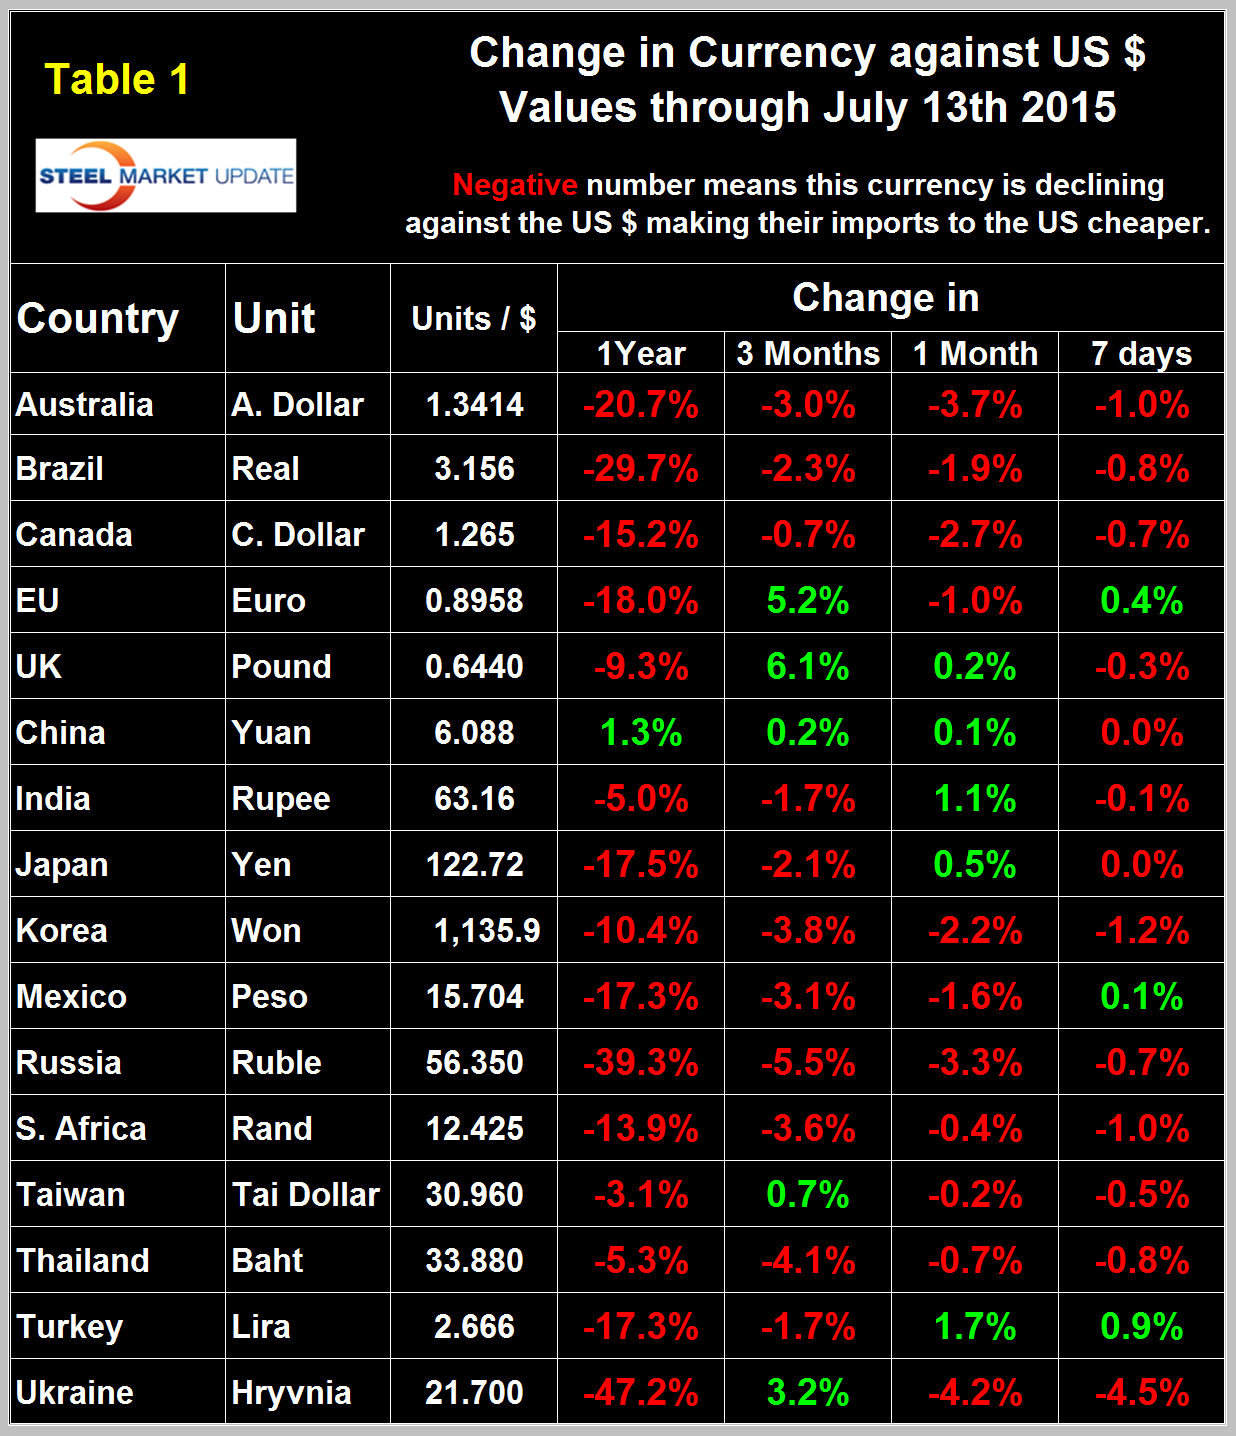
The table is color coded to indicate strengthening of the dollar in red and weakening in green. We regard strengthening of the US Dollar as negative and weakening as positive because the effect on net imports. In 2014, 25 percent of the U.S. economy was related to international trade therefore currency swings can have a huge effects on the economy in general and of the steel industry in particular. At the 12 month level the dollar has strengthened against every one of the steel trading currencies except China in each of the last eleven updates going back to October 11th.
In each of these reports we comment in some detail on a few of the 16 steel trading currencies but charts for each are available through July 13th for any reader who requests them.
At SMU we continue to regard the saga of the Euro as having the most significant future impact on the US steel industry. On September 6th last year the Euro broke through the 1.3 US $/Euro level for the first time since July 11th 2013, on January 6th it broke through 1.20 and through 1.10 on March 7th. It has strengthened erratically to 1.1163 on July 13th (Figure 2).
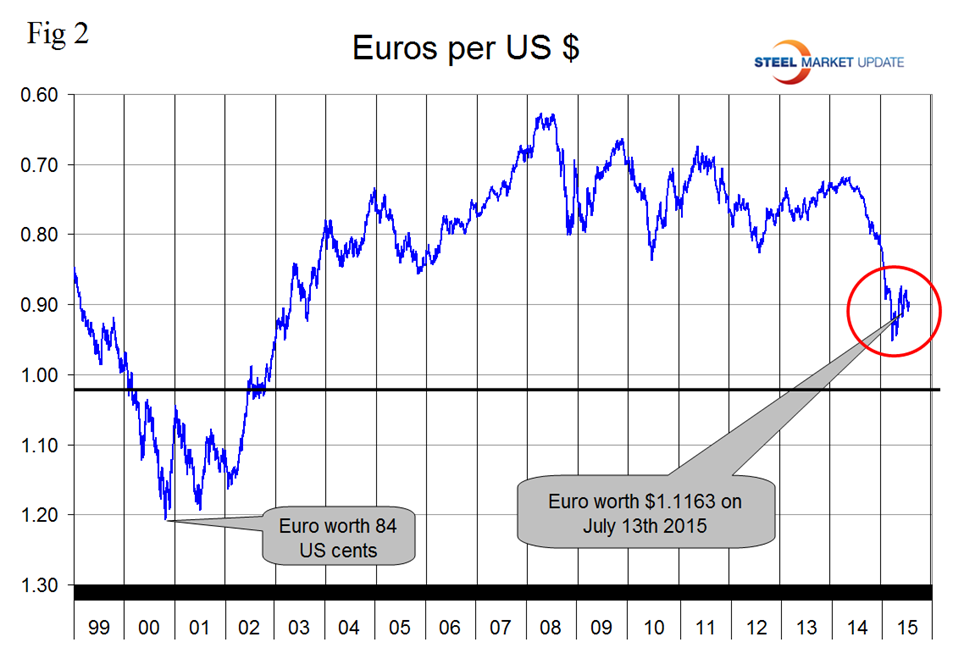
At SMU we continue to support the view that the Euro zone as it currently exists is unsustainable unless an integrated monetary and fiscal union is created which is what we have between these United States of America. We also believe that the likelihood of this happening is close to zero. Cullen Roach described this earlier this month in Seeking Alpha and we quote him here. “The EMU is a single currency system just like we have in the USA. The reason the USA works and the EMU doesn’t is because the USA has a system of rebalancing whereby poor states get more federal funding than wealthy states. That is, the Germany’s of the USA (California, Texas and NY) pay into what is essentially a system of wealth redistribution that keeps poor states (Mississippi, Alabama, etc.) from defaulting on their municipal bonds once every two decades. If there wasn’t a single currency this rebalancing could occur through the foreign exchange rate, but that doesn’t exist obviously. The EMU is flawed because they don’t have Euro Bonds and a Central Treasury. It’s a little more complex than that, but not by much. A Greek exit will be very messy, as it increases the odds of other countries leaving the Euro. The really scary outcome here is not a Grexit, but the potential for other exits. At the aggregate level, we know that the common currency will always cause a “Greece”. So, without some form of transfer mechanism inside the euro system, this is a problem that will recur periodically in the coming years. Letting countries leave or kicking them out does not solve an inevitable result of the currency system’s construction.”
The Turkish Lira has been plunging for 2 ½ years with a brief respite in the first half of last year (Figure 3).
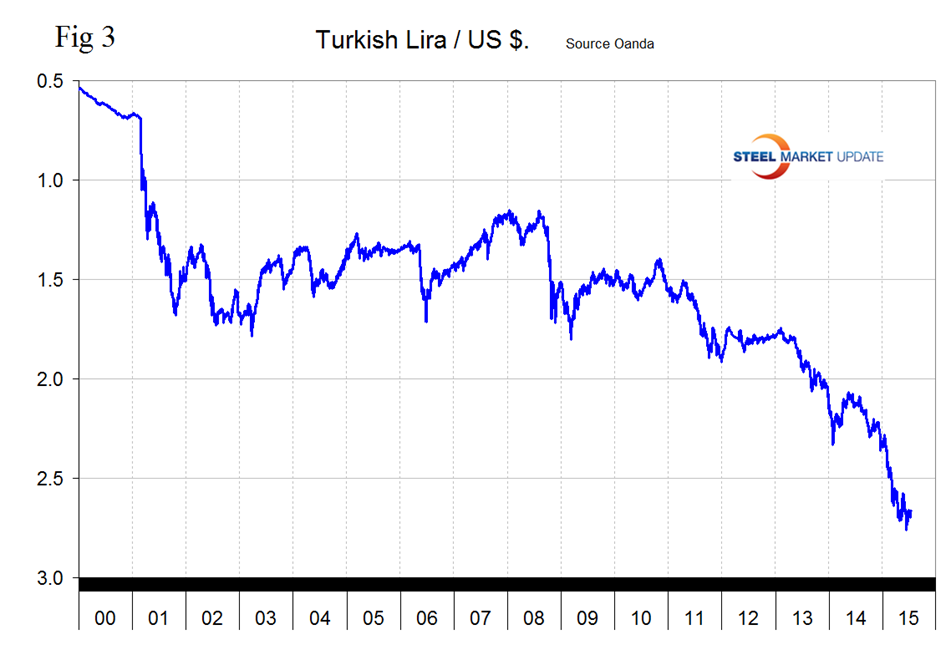
In the last 12 months the Lira is down by 17.3 percent with more volatility in the last three months. In June, the Turkish lending rate was unchanged at 7.5 percent, in line with expectations. Since the start of 2014, the key rate has been cut 250 basis points, from 10 percent, to current levels. Economic conditions in Turkey remain weak. Inflation is falling, alongside declining business confidence, pushing policymakers to demand further action to reverse the economy’s course. With declining investor sentiment in the area, the Turkish lira could weaken further in coming months.
The Canadian $ has declined by 15.2 percent in the last twelve months. In the last month it declined by 2.7 percent and stood at 79 US cents on July 13th (Figure 4).
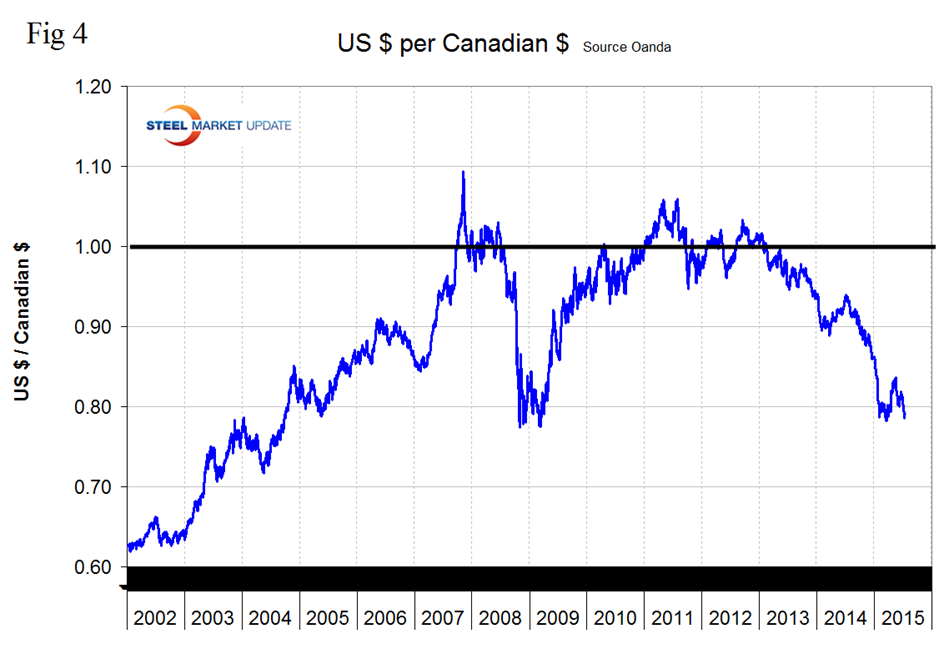
The Canadian dollar, like other commodity and interest rate sensitive currencies, has been under immense pressure from the flight to quality trading strategies. The loonie has also been dragged lower by softer crude and gold prices. Currently, fixed income traders are pricing in a 100 percent chance of a -25 basis point cut by the BoC in October, and is now starting to price in another cut in December. July’s Bank of Canada (BoC) business outlook survey has not been able to inspire the Canadian dollar. The general takeaway was that “it could have been worse.” Analysts noted that there were only some marginal improvements on some of the forward looking indicators that measure sales, investments and hiring’s from the last go-around.
The Australian $ has weakened by 20.7 percent in one year and by 3.7 percent in the last month (Figure 5).
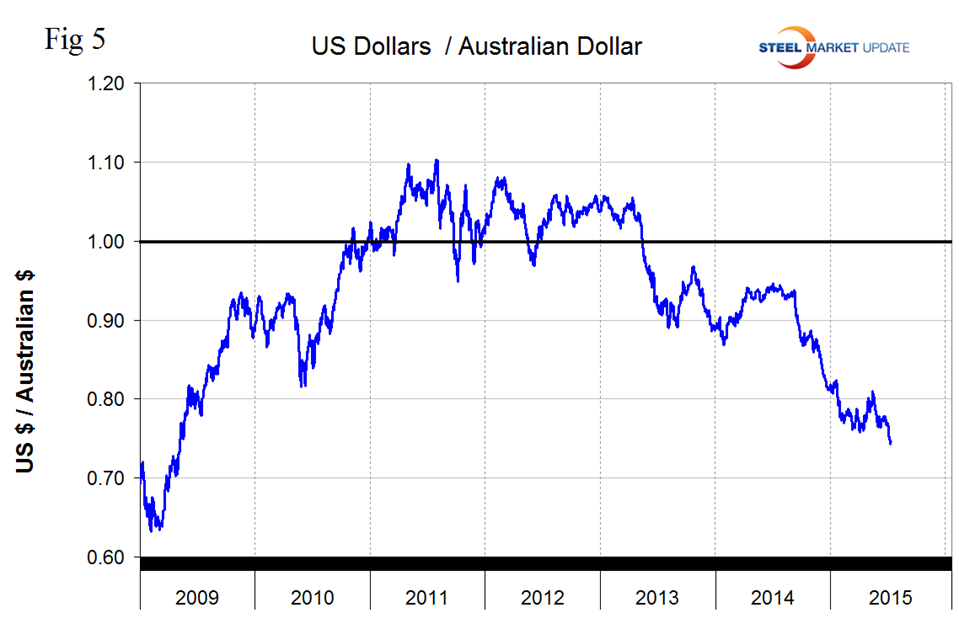
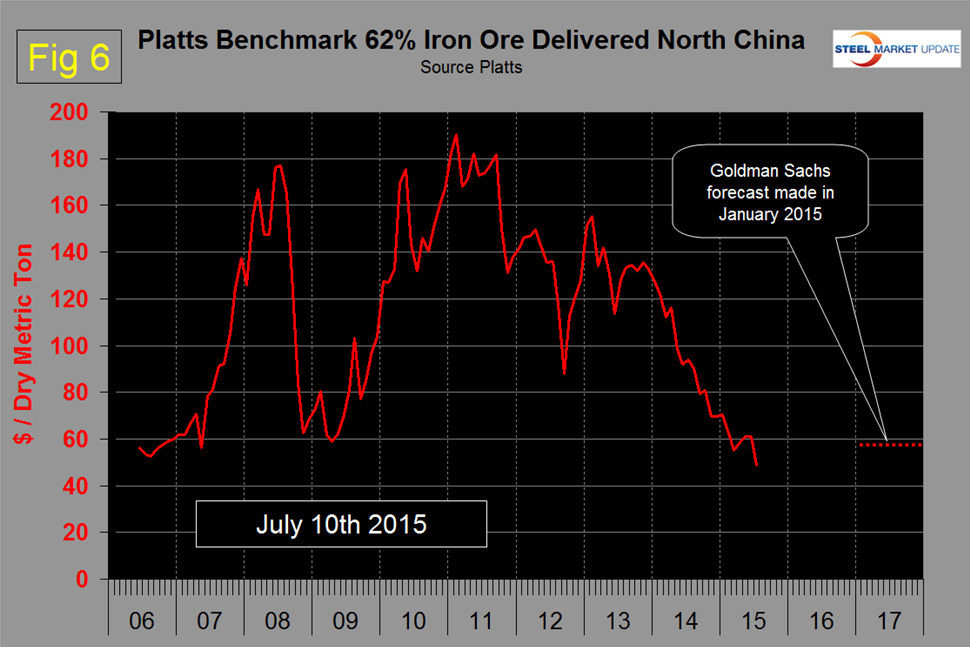
The Australian economy is highly dependent on the export of raw materials such as iron ore and coking coal. Last Friday, July 10th the IODEX 62 percent Fe delivered N. China declined to $48.75, the lowest level in over 10 years (Figure 6).
The Reserve Bank of Australia (RBA) has been at the forefront in guiding its “overvalued” currency lower with Governor Stevens prepared to talk down the Australian $ at every opportunity. In July RBA repeated its mantra that further depreciation seems both “likely and necessary.” Earlier in July the RBA left the cash rate target unchanged at a record low of +2 percent. The governor gave very little away during his press conference and is currently not rattled by Euro/Greek or China developments though he acknowledged the regional problems. Money markets continue to price in a further rate cut by the RBA before year-end. Expect slow growth, weak inflation and soft business investment to be cited as the trigger.
The Mexican Peso declined abruptly at the end of last year and more steadily though erratically ever since (Figure 7).
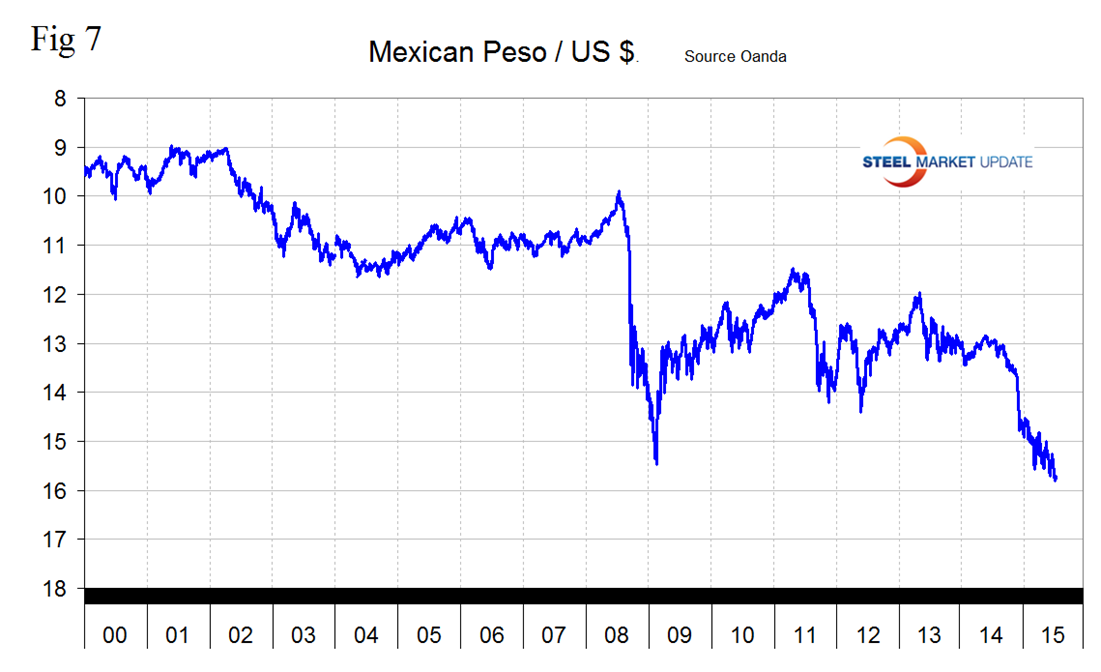
The peso is down by 17.3 percent in 12 months and by 1.6 percent in the last month. Economic activity has been adversely affected by lower factory output and weak consumer spending. This has weighed on investor sentiment, pushing the peso lower. With more U.S. dollar strength likely in coming months, the slowing Mexican economy should lead to further depreciation of the peso. In April, the industrial production figure came in at an annual pace of 1.1 percent growth, below the previous month’s reading of 1.7 percent, while also missing estimates for 1.4 percent. Industrial production growth peaked at over 5 percent in 2010. Mexican crude production has been declining and a slump in global oil prices has dampened expectations for a tide of investment under the country’s recent opening of its energy sector to private investment. Moreover, consumer confidence remains near multi-year lows. In June, the consumer confidence measure came in at 94.7, a reading below 100 signals pessimism. Since the financial crisis, consumer sentiment has remained in pessimistic territory. Effects on higher taxes due to fiscal reform are slightly fading, but are keeping sentiment suppressed according to the Financial Times. In the first quarter, the economic growth figure came in at an annual pace of 2.5 percent. Since peaking at over 6 percent in 2010, economic growth has been slowing.
SMU Comment: The dollar strengthened against 13 of the 16 steel trading nation currencies in the last seven days and it looks as though the upward trajectory has resumed. The probability of a yield increase for US treasuries coupled with quantitative easing elsewhere will drive the dollar value higher. This is not good for US steel producer competitiveness. The currency trends will continue to attract imports and suppress both exports and raw materials prices.
Explanation of Data Sources: The broad index is published by the Federal Reserve on both a daily and monthly basis. It is a weighted average of the foreign exchange values of the U.S. dollar against the currencies of a large group of major U.S. trading partners. The index weights, which change over time, are derived from U.S. export shares and from U.S. and foreign import shares. The data are noon buying rates in New York for cable transfers payable in the listed currencies. At SMU we use the historical exchange rates published in the Oanda Forex trading platform to track the currency value of the US $ against that of sixteen steel trading nations. Oanda operates within the guidelines of six major regulatory authorities around the world and provides access to over 70 currency pairs. Approximately $4 trillion US $ are traded every day on foreign exchange markets.


