Market Segment

July 19, 2015
Service Center Flat Rolled Shipments in a Rut & Inventories are Too High
Written by Peter Wright
There seems to be more inaccurate analysis published on this subject than on any other that we track at Steel Market Update. For example on Saturday AMM reported that, “US steel service center shipments improved in June compared with the previous month ——-.” At a superficial level this statement is correct, but as an analysis of the actual direction of this sector of the market, we believe it is quite wrong. The problem is that service center shipments vary from somewhat seasonal to extremely seasonal during the course of a year and the number of shipping days in a month varies from 19 to 23. In our SMU analysis we report each month on the seasonality issue and prefer to draw our conclusions from a tons per day comparison with previous months in preference to a tons per month comparison. In reality tons per month did increase in June as AMM reported but tons per day decreased. The tons per day angle was absent from the AMM report.
Here is our take on the June data from the MSCI.
Total service center carbon steel shipments increased by 277,400 tons in June to 3.404 million tons. Shipping days at 22, were two more than May. On a tons per day basis (t/d) shipments decreased from 156,300 in May to 154,700 in June.
In the twelve years since 2004 June shipments on average have been down by 2.1 percent from May, this year shipments were down by 1.5 percent. May and June were the first months this year in which the shipment change month over month was better than the 12 year average. Figure 1 demonstrates the seasonality of service center shipments and why comparing a month’s performance with the previous month is usually misleading. For this reason in the SMU analysis we always consider year over year changes.
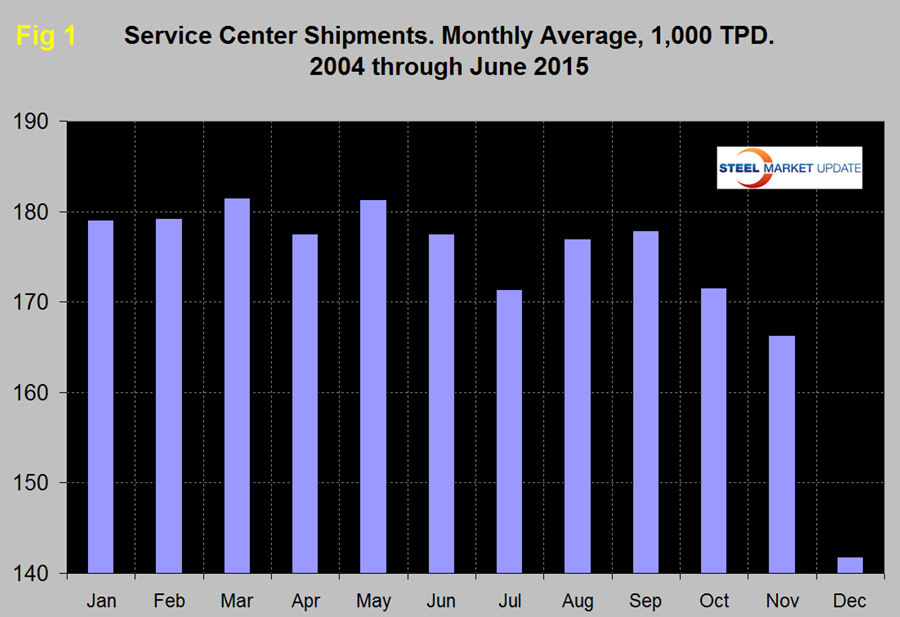
Table 1 shows the performance by product in June compared to the same month last year and also with the average t/d for June in the last three years. We then calculate the percent change between June 2015 and June 2014 and with the 3 year June average.
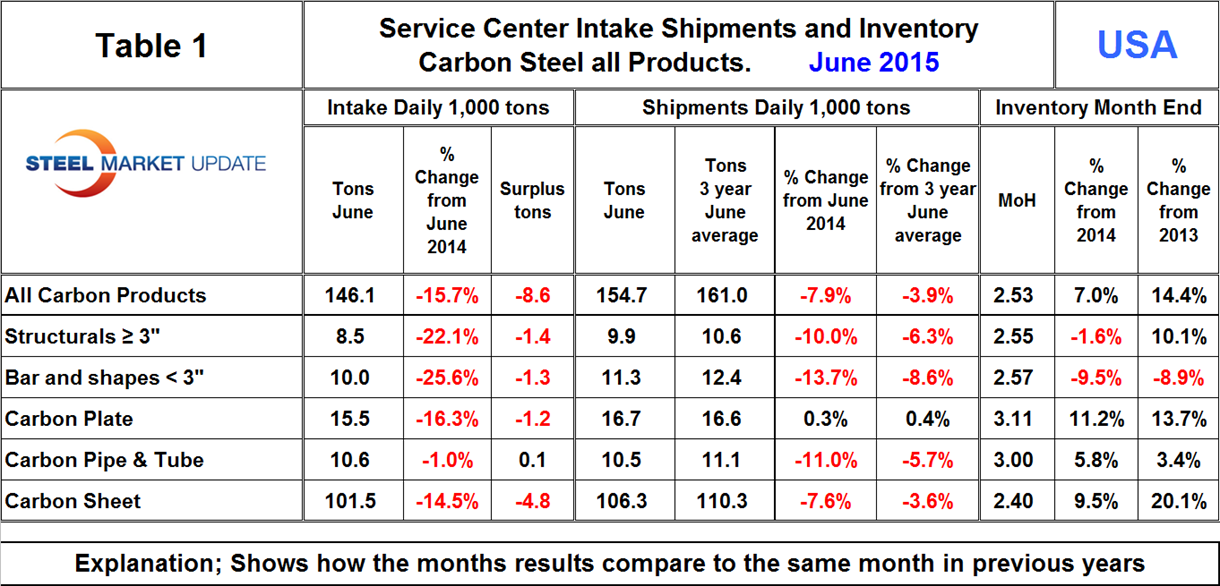
We hope this give the best view of market direction. In June intake at 146,100 tons was 8,600 tons less than shipments. This was the fifth straight month where intake has been less than shipments. Pipe and tube was the only product for which intake was slightly more than shipments in June.
Shipments of all products on a t/d basis were down by 7.9 percent from June last year and were 3.9 percent less than the average June shipments for 2015, 2014 and 2013. The fact that the single month growth comparison is worse than the three year comparison is an indication that momentum is negative and growth is slowing. Shipments of all products except plate were down year over year on a t/d basis.
June closed with months on hand (MoH) at 2.53, down from 2.81 at the end of May but up from 2.28 at the end of June last year. Structurals and bars had a y/y inventory decrease and plate, sheet and tubulars had an inventory increase.
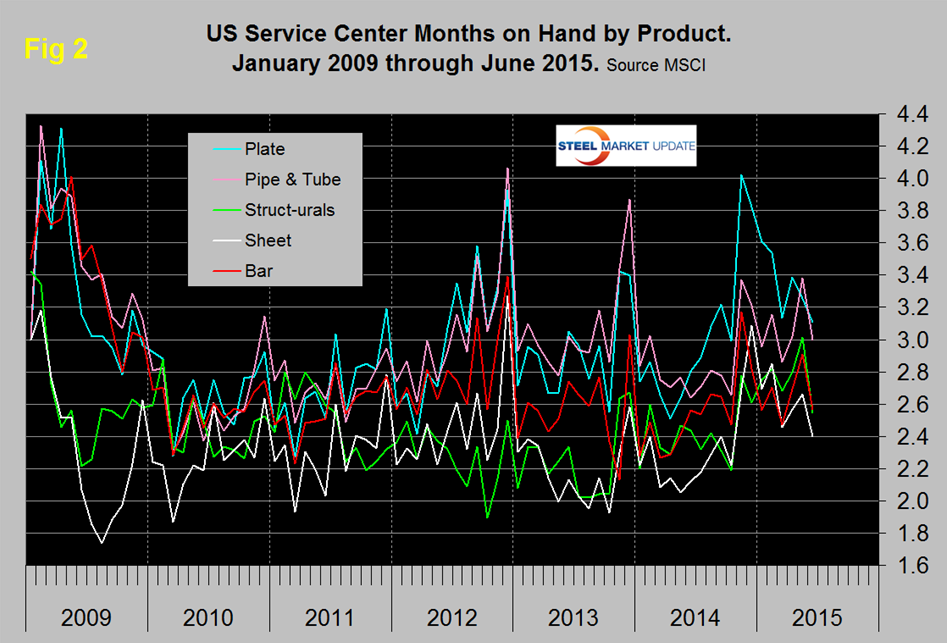
Figure 2 shows the MoH by product monthly since January 2009. All products had a decrease in MoH in June compared to May. Plate products shot up to over 4 MoH at the end of November and still had the highest MoH at the end of June.
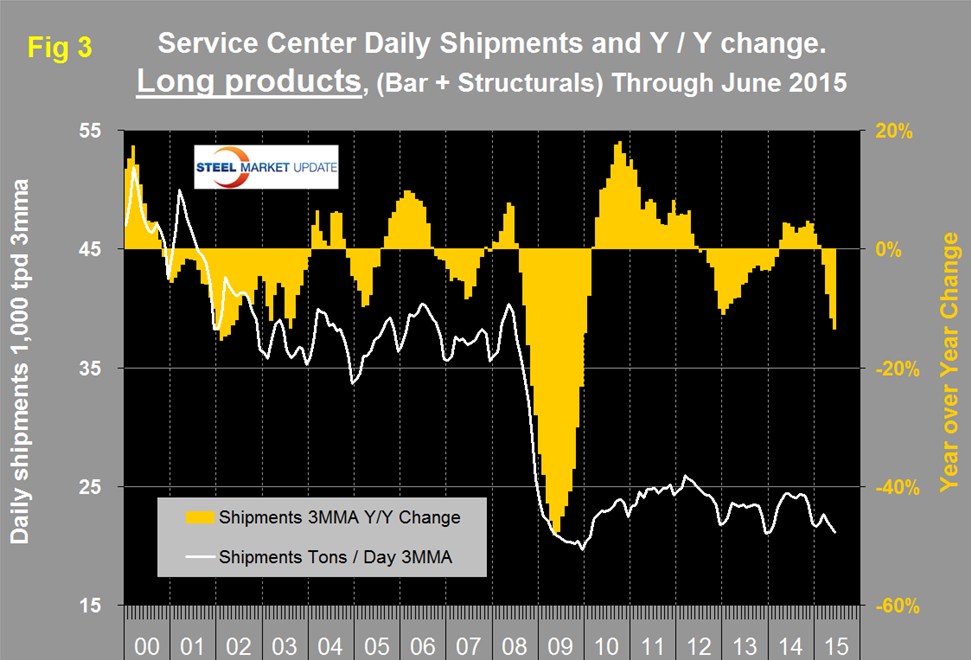
There continues to be a wide difference between the performances of flat rolled (sheet + plate) and long products (structurals + bar) at the service center level. Long products have had a very poor recovery from the recession.
On a 3MMA basis y/y, the growth of shipments was negative for 21 straight months until April last year which was the first of eleven months of growth. However in March on a y/y basis shipment growth returned to negative territory at -2.6 percent followed by April at -7.6 percent, May at -11.6 percent and June at -13.5, (Figure 3).
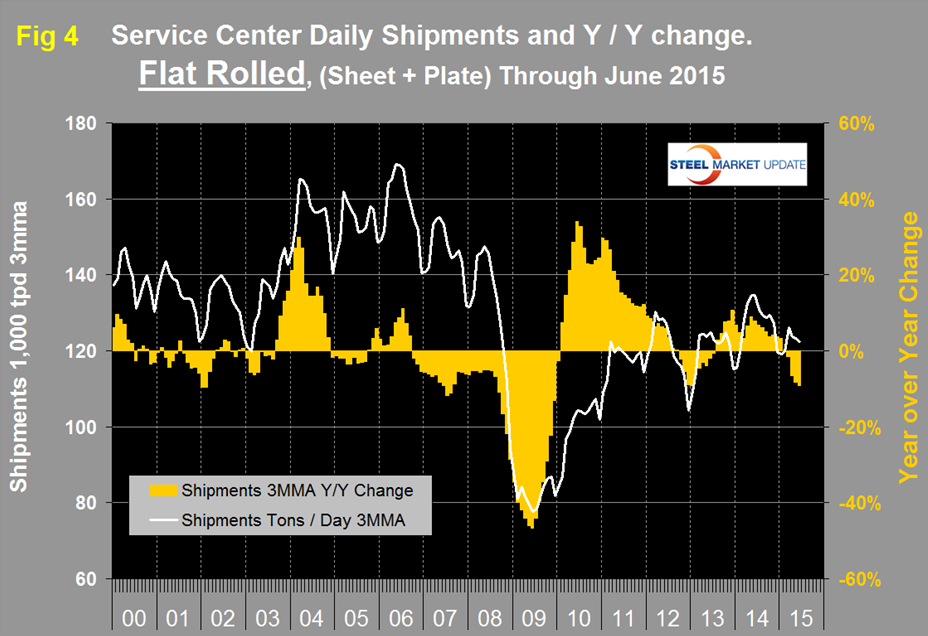
Flat rolled has had a much better recovery since mid-2009 and had positive y/y growth for 18 straight months through January this year. In February growth slowed to zero, in March came in at negative 1.6 percent followed by April at -6.6 percent, May at -8.3 percent and June at -9.1 percent (Figure 4).
In 2006 and 2007, the mills and service centers were operating at maximum capacity. Figure 5 takes the shipments by product since that time frame and indexes them to the average for 2006 and 2007 in order to measure the extent to which service center shipments of each product have recovered.
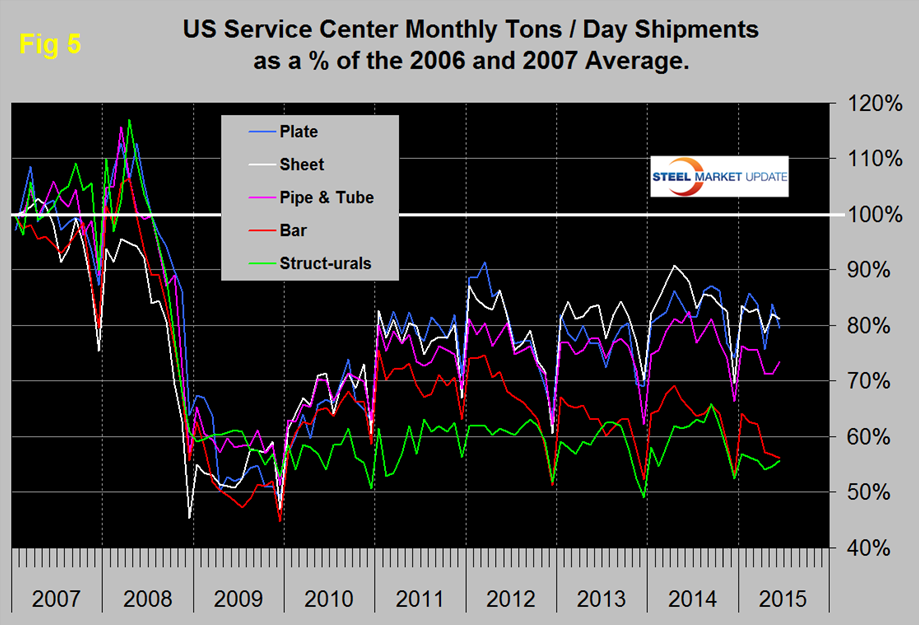
Again it can be seen that bar and structurals have the worst record. Sheet and plate have had the best recovery since the recession followed by tubulars. Even so the recovery of sheet is only at 81.2 percent and plate at 79.5 percent. The total of carbon steel products is now at 72.9 percent of the shipping rate that existed in 2006 and 2007, with structurals and bar at 55.8 percent and 56.2 percent respectively.
MSCI uses product nomenclature flat and plate. In this analysis at SMU we replace the term flat with sheet. By our interpretation of the MSCI’s data their definition of ‘flat’ is all hot rolled, cold rolled and coated sheet products. Since most of our readers are sheet oriented we have removed plate from Figure 4 to highlight the history of sheet products which are shown in Figure 6.
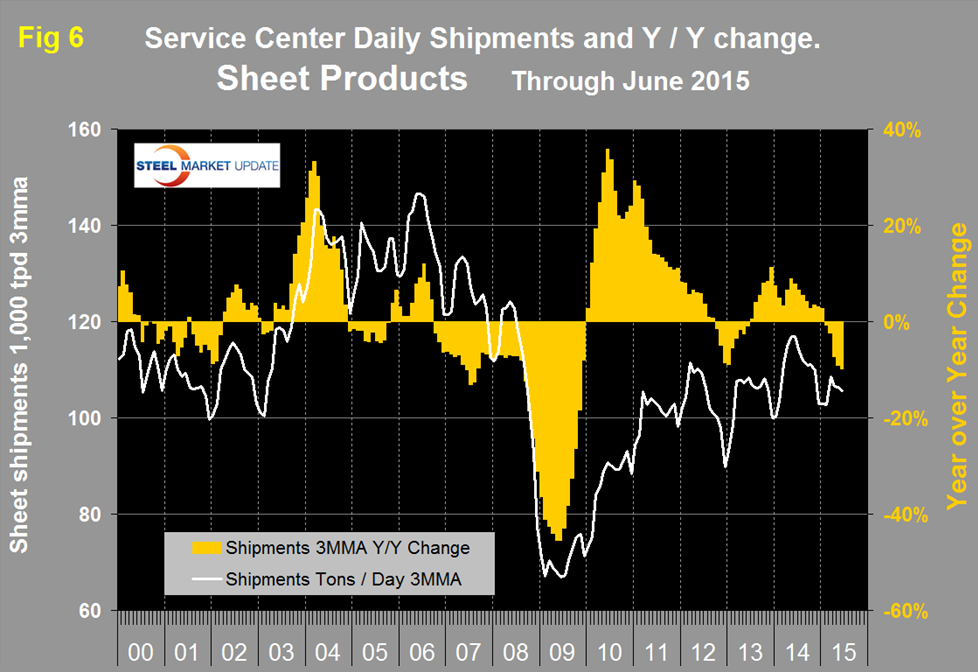
Following the strong post-recession recovery, sheet products experienced 9 months of decline from October 2012 through June 2013. This was followed by eighteen months of growth through January this year but February slipped back into negative territory at -0.7 percent year over year, the March result was -2.3 percent followed by April at -7.3 percent, May at -9.1 percent and June at -9.8 percent.
SMU Comment: Shipment data out of the MSCI is becoming increasingly negative for all products on a year over year basis and compared to this time last year the end of June MoH is up for all products. This analysis is in alignment with our reports of total supply to the market which is based on AISI shipment and import data. Total supply of hot rolled products in May (latest month available) was down by 11.9 percent year over year.
The SMU data base contains many more product specific charts than can be shown in this brief review. For each product we have ten year charts for shipments, intake, inventory tonnage and months on hand. Readers are welcome to these on request.