

Market Data

July 26, 2015
The Big Questions: Demand & Inventories
Written by John Packard
At this point everyone wants to know if demand is growing and are inventories at a point where buyers will need to go into the market and begin buying again. The combination of growing demand and inventories that need to be replenished will be what drives flat rolled steel prices higher.
Steel Market Update looks at these two issues, demand and inventories, in a number of ways during our flat rolled steel market analysis that we conduct twice per month. Last week we sent out invitations to participate in our questionnaire on the market and in this article we will focus on what we learned.
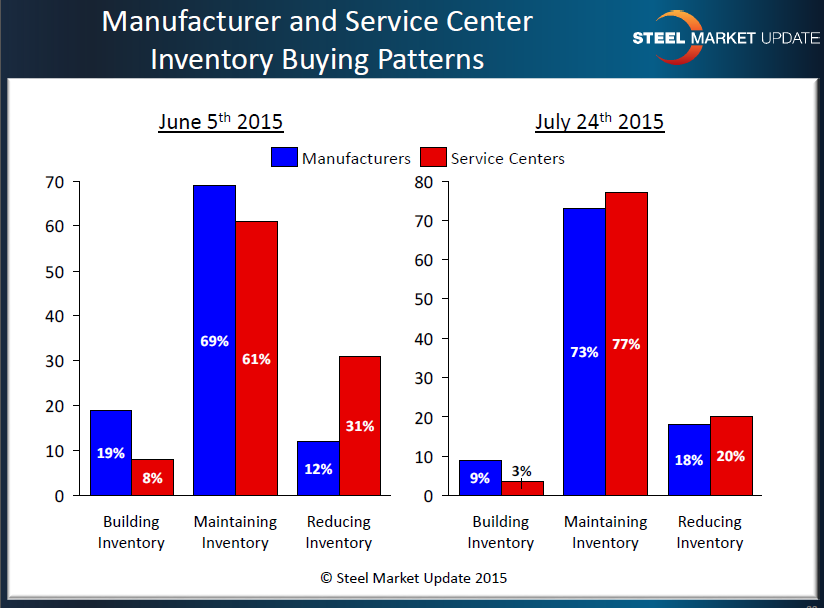
In the graphic below, SMU is concentrating on evaluating whether service centers or manufacturing companies are either building or reducing inventories and if inventories should be considered balanced (as there is always a small percentage of companies having to build or reduce depending on market pressures, seasonal issues, etc.). We found that the vast majority of the service centers and manufacturing companies were reporting inventories as being balanced (77 percent service centers and 73 percent manufacturing companies). The percentage of distributors reporting their company as reducing inventories dropped from 31 percent at the beginning of June to 20 percent this past week. Manufacturing companies remained about the same as what they were reporting at the beginning of June.
We do keep a history of these responses from both the manufacturing and service centers. Looking at the data from a longer term perspective, we found that the manufacturing companies had a little spurt of buying (or building inventories) back in May and June of this year before tailing off to their current 9 percent level during the month of July.
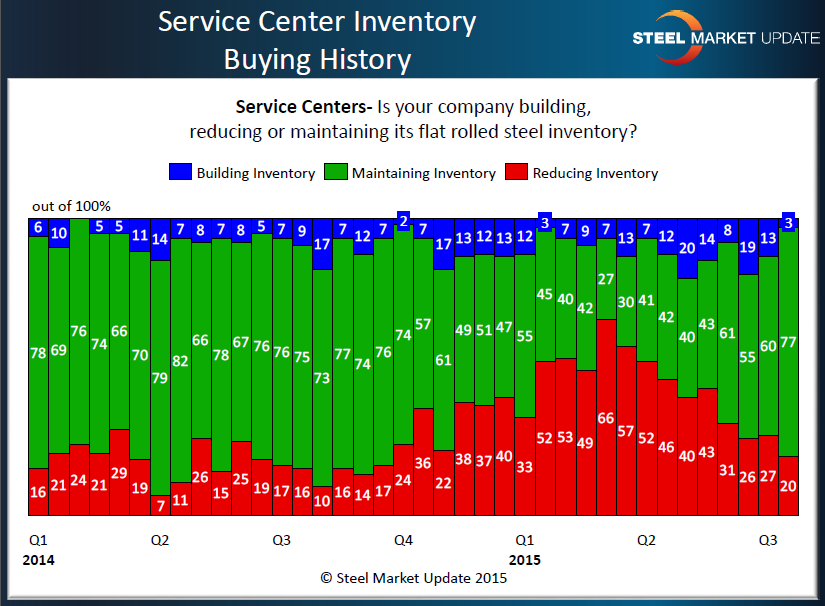
The service center data shows a much more dramatic change in their inventory trend. As you can see by the graph below, service centers have been in a strong inventory reduction mode beginning in the 4th Quarter 2014 and continuing until just recently. There were some buying blips which were most likely associated with price increase announcements and the coated trade suit. But, as you can see, we haven’t seen this kind of balanced inventories since late third quarter of last year.
Now let’s turn our attentions to demand and what we can learn from those participating in our questionnaire.
We look at demand from a number of angles in order to track trends as closely as possible. First we asked all of our participants (45 percent of which were manufacturing companies, 40 percent service centers, 9 percent trading companies, 4 percent toll processors and 2 percent steel mills) if demand for their products was improving, remaining the same or declining. The results from that question from this past week are below:
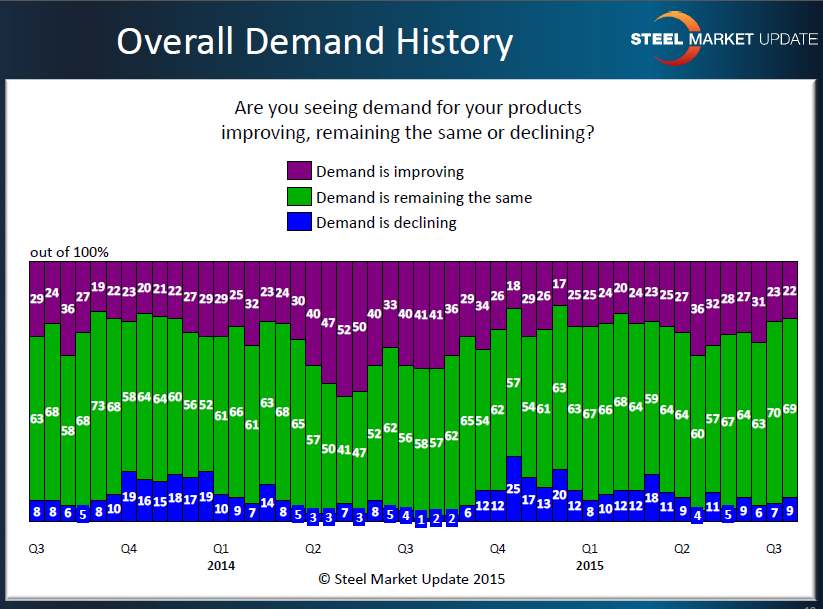
As you can see last year (2014), we saw strong demand growth during the late first and through most of the second quarter before slowing a bit in third quarter and then dropping off at the end of the year. So far this year (2015), we did not see the growth we would expect to see during the second quarter and, with 22 percent reporting demand as improving, we are at the lowest level seen since the first quarter of this year.
We wanted to look at demand in more detail so we went to both the manufacturing and distribution segments of our market analysis to see what we could learn from both groups.
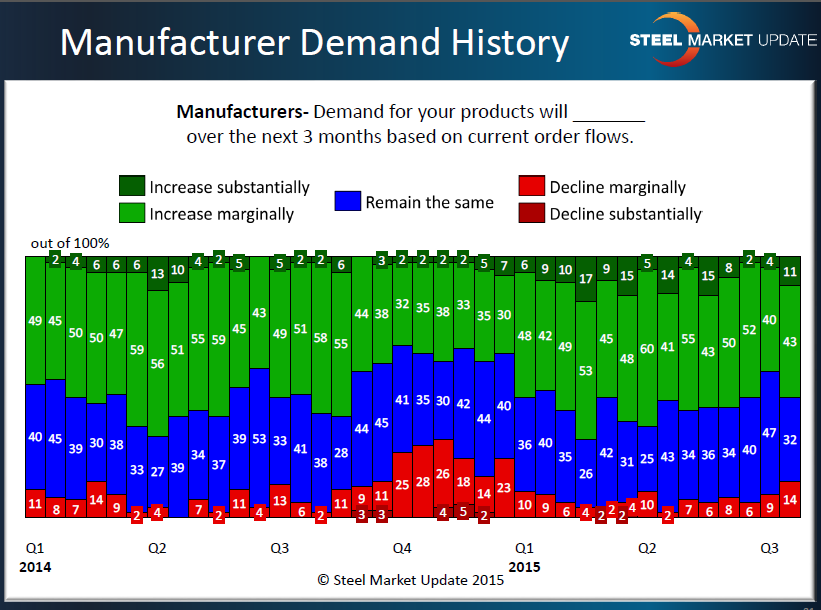
First, from the manufacturers we saw an optimistic flow of anticipated business in the coming three months. The majority of manufacturers responding to our questionnaire reported that demand for their products over the next three months would either “increase marginally” (41 percent) or “increase substantially” (11 percent). Only 14 percent (which is up slightly from what we have seen over the past 7 months) reported business would “decline marginally” over the next 3 months.
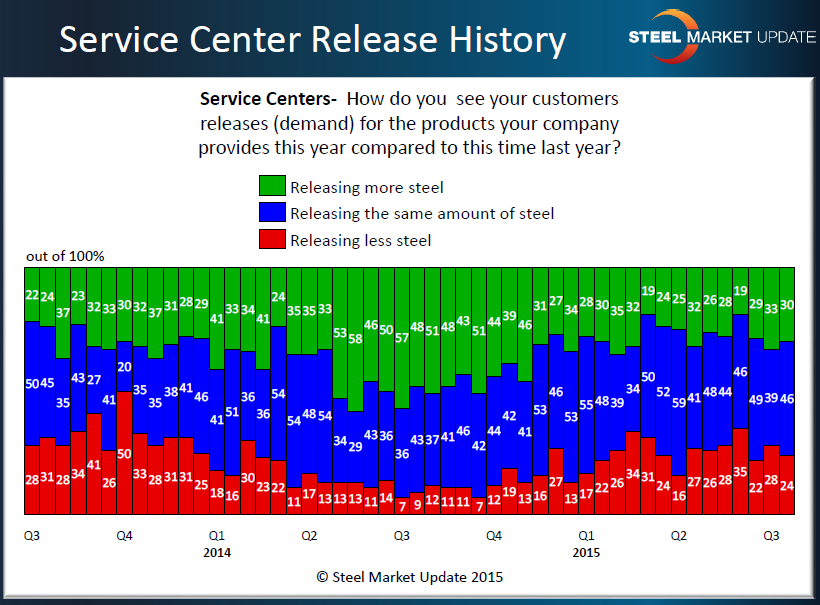
From the service center perspective we saw a balanced trend as we asked them about demand based on releases of steel this year compared to the prior year. Thirty percent reported that their customers were releasing more steel, 24 percent reported their customers as releasing less steel and the balance (46 percent) reported that they were releasing about the same amount of steel as the previous year.
We then asked a new question of the entire group participating in last week’s analysis. We asked our participants, “At what point in time will your company need to increase domestic steel purchases?”
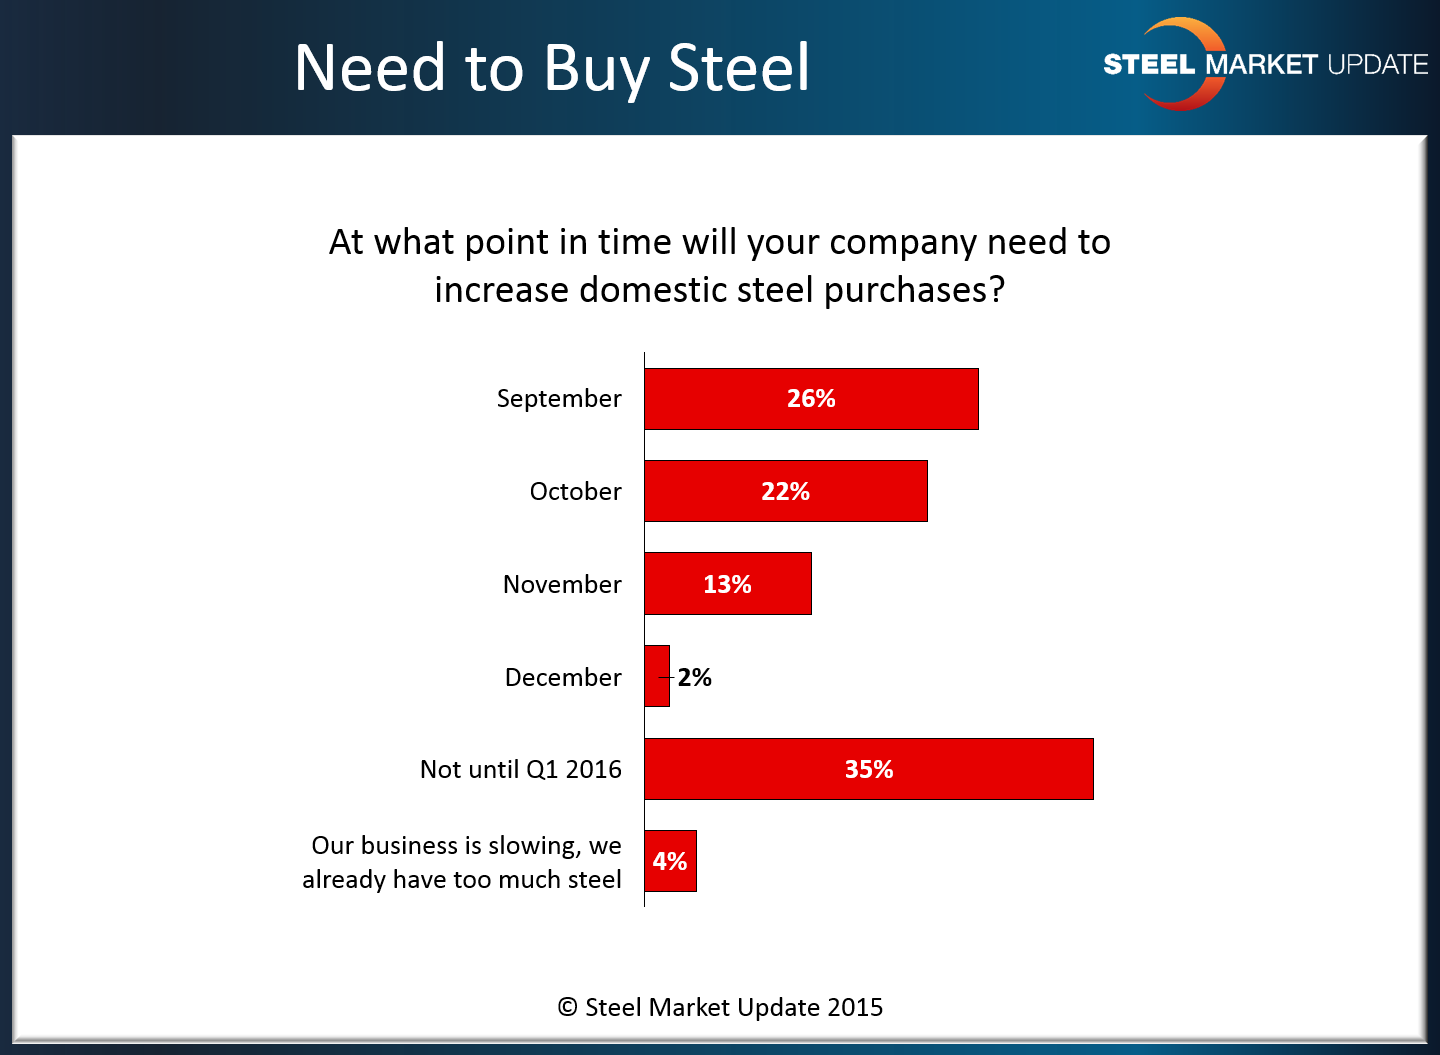
What we were trying to determine was whether there was a point in time when the domestic mills could anticipate a surge in orders. I don’t think we accomplished that as one of our participants pointed out in a comment left behind during the process of answering this question:
“The question assumes that imports will cease, stem, or be unavailable. This may or may not be the case and makes the question impossible to answer at this time.” Manufacturing company


