Prices

August 21, 2015
Global Steel Production and Capacity Utilization in July 2015
Written by Peter Wright
Global steel production in 12 months through July totaled 1.619 billion tonnes with a capacity of 2.3 billion tonnes. Capacity utilization in July was 68.4 percent with a three month moving average (3MMA) of 70.4 percent, down from 71.6 percent in three months through June. China accounted for 49.4 percent of global production in July. Asia as a whole, including India, accounted for 68.0 percent. Production in July on a tons/day basis was 4.297 million tonnes, down from 4.393 in June.
![]() Tons per day declined in May, June and July. The seasonal pattern evident since the recession is different in 2015. Total July production was 133.210 million tonnes. If we look at the three month moving average and plot it over time we see that there has been a significant decline in the second half of the year since and including 2010 which usually extends into February, after which production kicks up rapidly (Figure 1).
Tons per day declined in May, June and July. The seasonal pattern evident since the recession is different in 2015. Total July production was 133.210 million tonnes. If we look at the three month moving average and plot it over time we see that there has been a significant decline in the second half of the year since and including 2010 which usually extends into February, after which production kicks up rapidly (Figure 1).
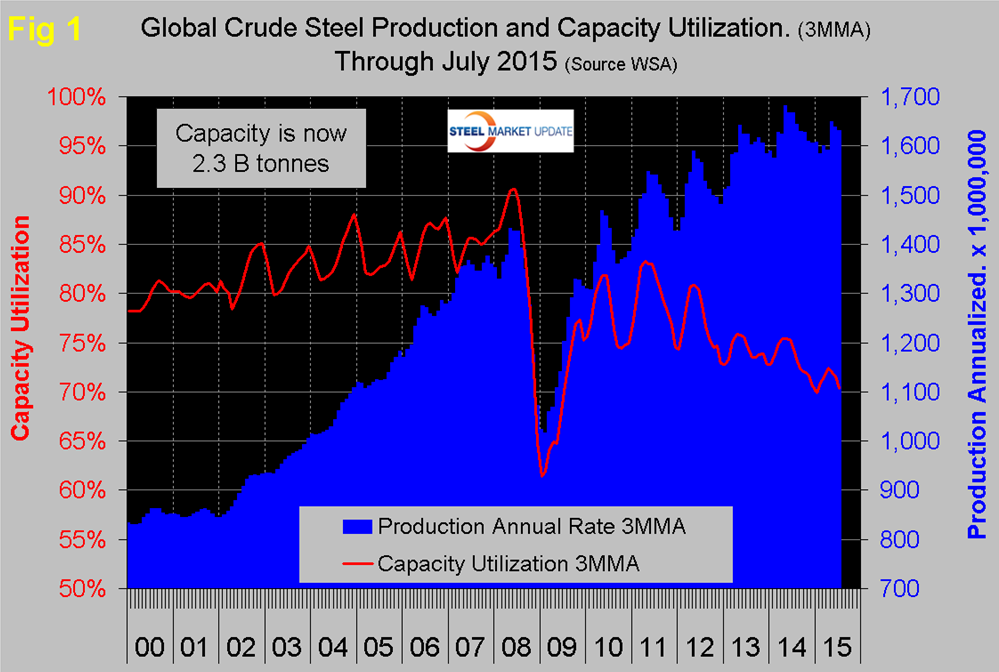
In 2015 the uptick was delayed until May and it is evident that the high point of 2014 won’t be reached this year. As production has increased each year since the recession, capacity utilization has decreased, the gap is widening and has been estimated that surplus capacity is currently as much as 500 million tons per year, well over half of which is in China.
Table 1 shows global production broken down into regions and also the production of the top ten nations in the single month of July and their share of the global total. It also shows the latest three months and twelve months production through July with year over year growth rates for each.
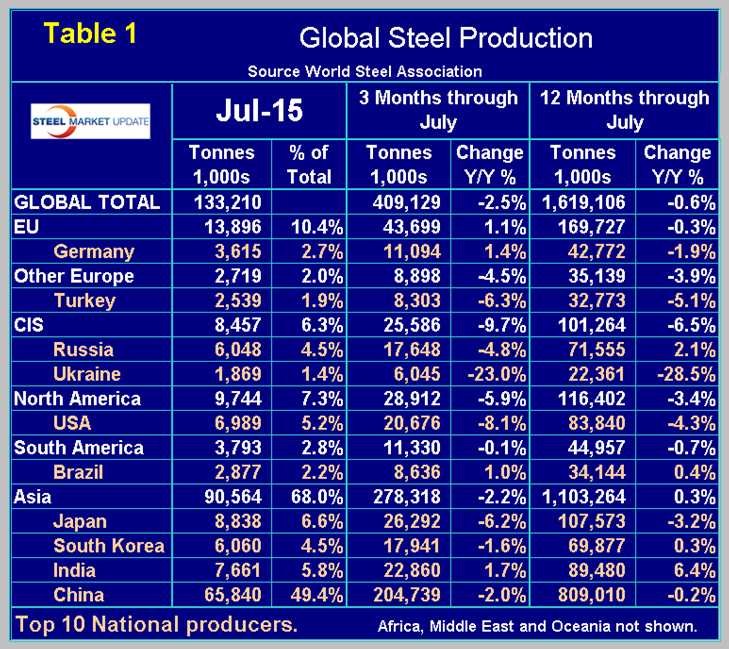
Regions are shown in white font and individual nations in beige. If the three month growth rate exceeds the twelve month we interpret this to be a sign of positive momentum and accelerating growth. The world as a whole currently has negative momentum with a negative growth of 2.5 percent in 3 months and negative 0.6 percent in 12 months. The rolling 12 month growth rate in April, May, June and July was +0.6 percent, +0.3 percent, -0.2 percent and -0.6 percent respectively.
Clearly the global steel market is slowing; Asia as a whole had negative momentum in the latest data as did other Europe, the CIS and North America. The EU and South America had positive momentum. Comparing the three months through July in 2014 and 2015, the only region to have positive growth was the European Union. The only nations in the top 10 on the same basis to have positive growth were Germany, Brazil and India with 1.4 percent, 1.0 percent and 1.7 percent respectively. In the July data China was down by 2.0 percent in three months year over year, North America was down by 5.9 percent in total with the US down by 8.1 percent, Canada down by 1.4 percent and Mexico up by 0.8 percent. The European Union was up by 1.1 percent and other Europe was down by 4.5 percent led by Turkey down by 6.3 percent. The effect of the war in Ukraine is clear in the contraction of that country’s steel production though the rate of contraction is slowing.
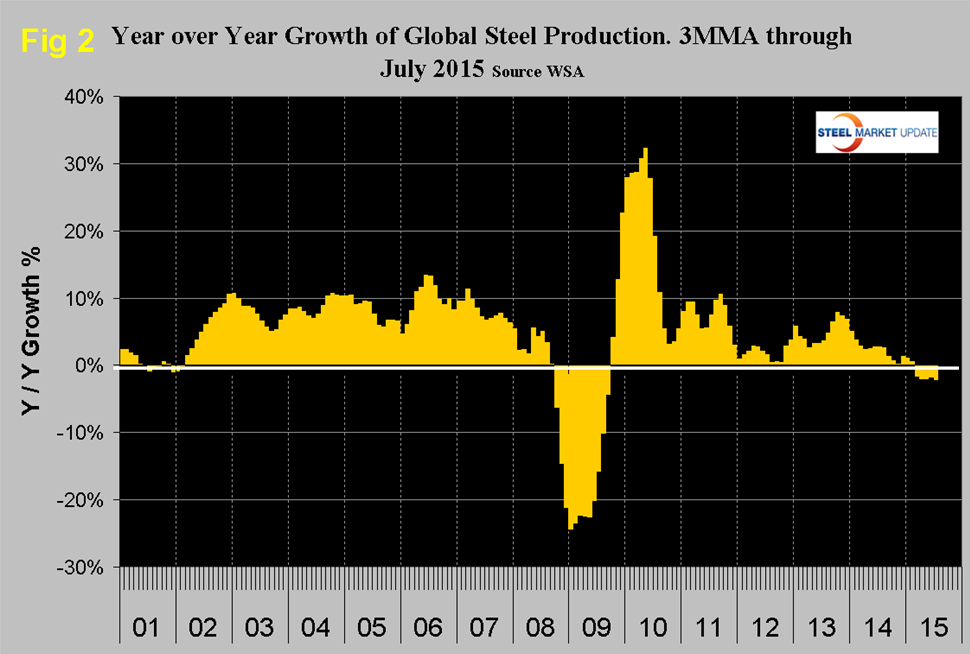
Figure 2 shows the 3MMA of the monthly year over year growth of global steel production which was negative in March for the first time since September 2009. March, April, May, June and July were down by 1.6 percent, 2.0 percent, 2.0 percent, 1.8 percent and 2.2 percent respectively year over year.
We are again publishing the latest World Steel Association Short Range Outlook forecast for apparent steel consumption in 2015 and 2016 that was released in April. We will leave it in these reports until the next revision is released. The forecast for 2015 continues to looks optimistic and that is increasingly the case (Table 2). Note this forecast is steel consumption, not crude steel production which is the main thrust of what you are reading now.
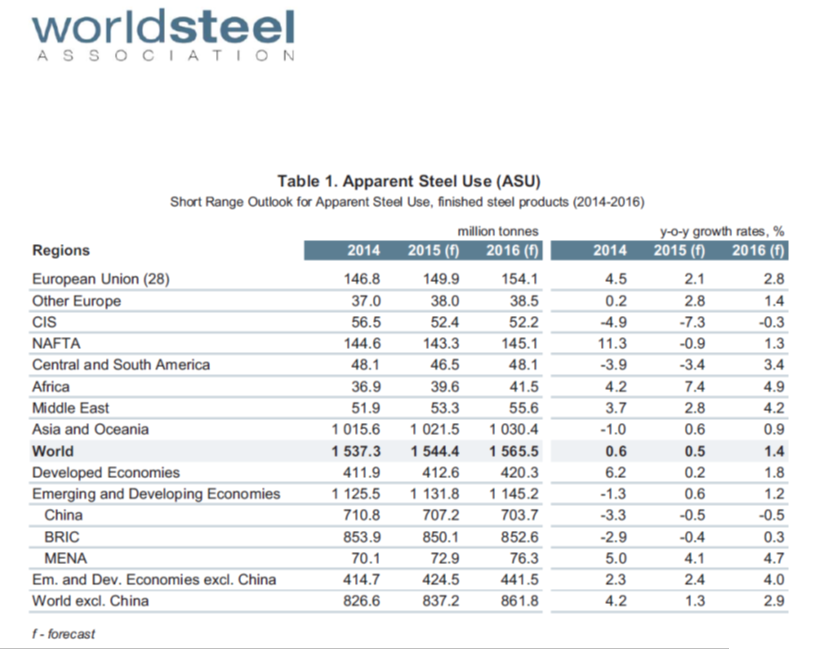
WSA are forecasting a 0.5 percent growth in demand this year followed by 1.4 percent in 2016. Based on this analysis by the WSA, NAFTA has by far the largest deterioration in demand between 2014 and 2015, changing from +11.3 last year to -0.9 percent this year. We read the global trends as worse that the WSA forecast suggests. The recent decline in the price of oil, of iron ore and of the Baltic Index suggests that the global economy is weakening. Certainly there is a supply side to all three of those measures but it seems that demand is also down and suggests a further slowdown in global steel production in 2015.