

Analysis
January 24, 2025
Global steel production falls back in December
Written by Brett Linton
Editor’s note: Steel Market Update is pleased to share this Premium content with Executive members. For information on how to upgrade to a Premium-level subscription, contact Luis Corona at luis.corona@crugroup.com.
The volume of crude steel produced around the world declined 2% month over month (m/m) in December, according to the World Steel Association (worldsteel). This is the second consecutive monthly decline in production, following November’s 3% m/m drop.
Global mill output totaled 144.5 million metric tons (mt) in December, the second-lowest monthly rate this year. December is 6% below the average monthly rate for 2024 (152.9 million mt), but 6% greater than the same month one year prior (136.8 million mt).
This brings annual production to a total of 1.84 billion mt for 2024. This yearly figure is almost identical to both 2023 (1.85 billion mt) and 2022 (1.83 billion mt). Looking back over the last decade, the year with the highest production was 2021 at 1.90 billion mt, while the lowest was 2015 at 1.59 billion mt.
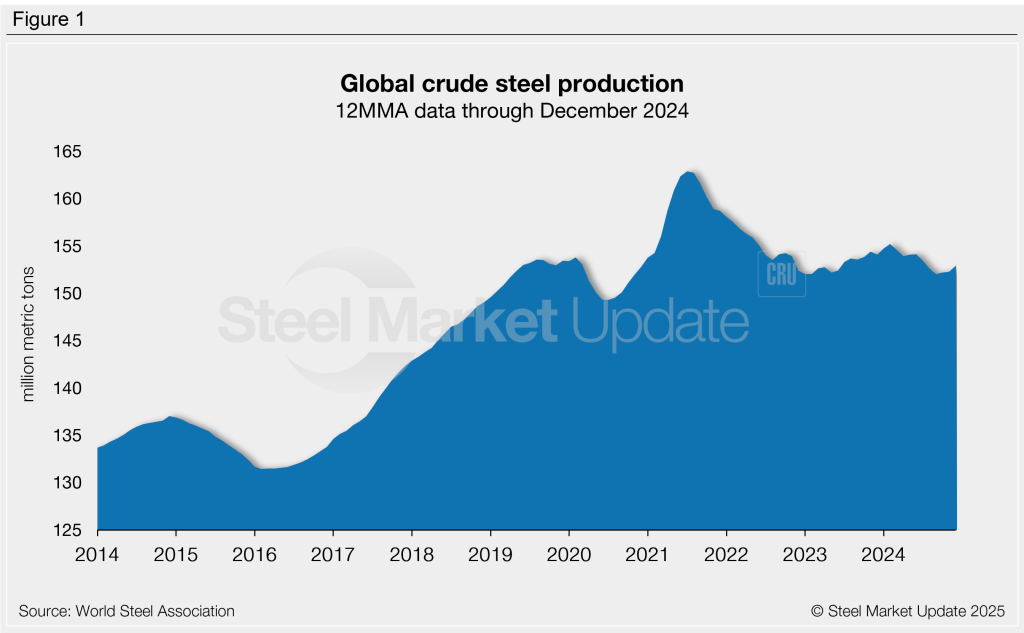
On a three-month moving average (3MMA) basis, world production rose to a four-month high of 147.9 million mt through December. On a 12-month moving average (12MMA) basis, production has averaged 152.9 million mt per month over the past year (Figure 1). This is 1% lower than the December 2023 12MMA of 154.0 million mt.
On a daily basis, December production averaged 4.66 million mt per day. This is 5% lower than November’s daily rate, but 6% higher than the same month last year.
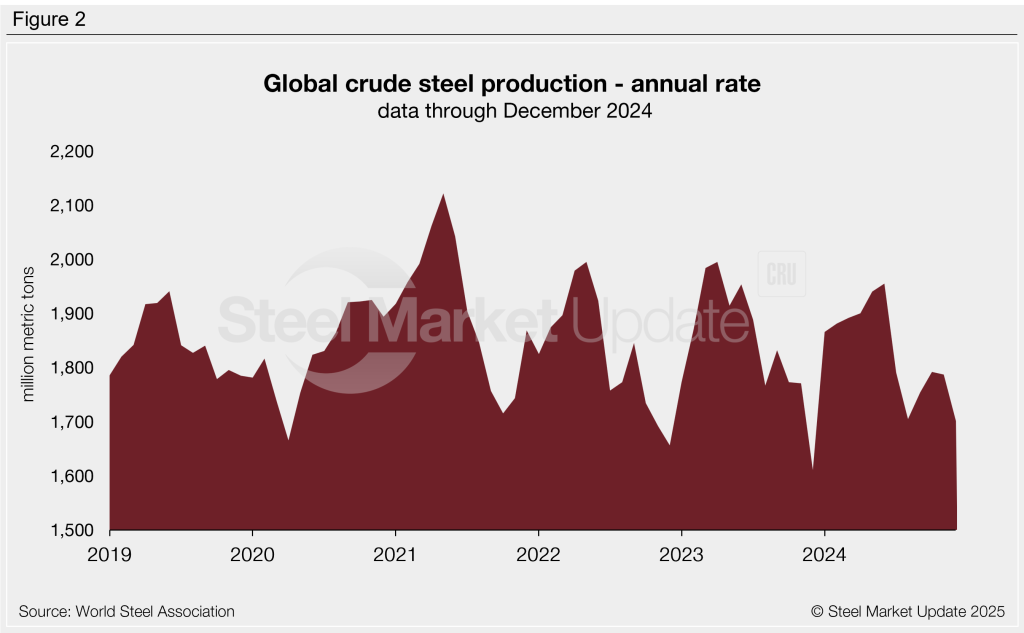
Annualizing the daily production rate in December yields an annual production rate of 1.70 billion mt (Figure 2). This figure has declined each of the last two months. One year ago the annual rate was 1.61 billion mt in December, two years ago it was 1.66 billion mt.
Regional breakdown
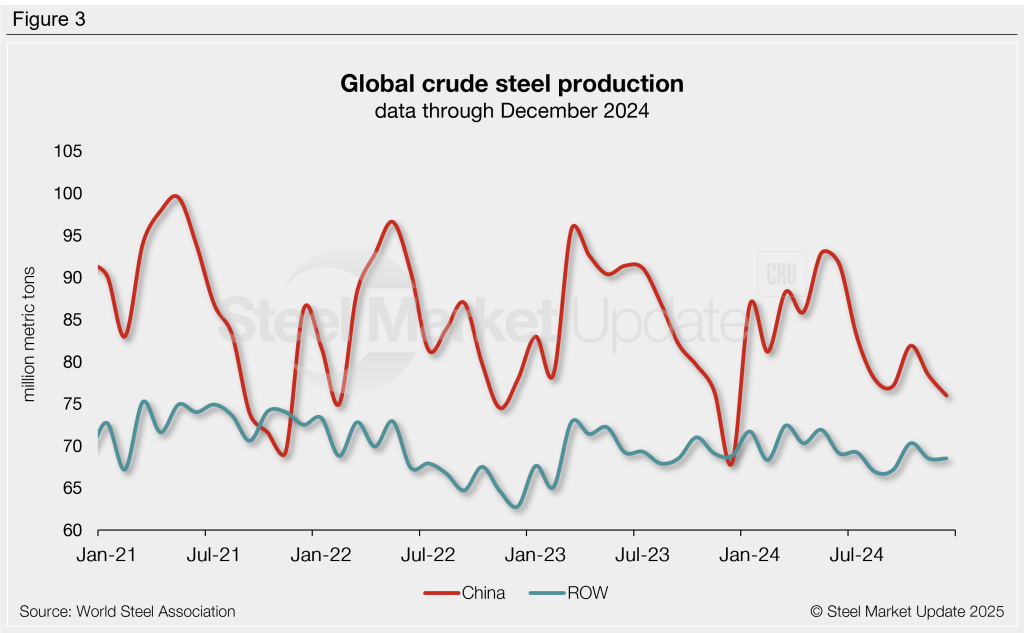
China, the world’s top steel producer, produced 76.0 million mt last month (Figure 3). This is 3% lower than November, but 12% greater than the same month one year prior. Recall that earlier in 2024, Chinese production climbed to a 14-month high of 92.9 million mt in May. Chinese production averaged 83.4 million mt per month across 2024, down from 84.7 million mt per month in 2023.
Chinese production accounted for 53% of the world’s total steel output in December, similar to the prior five months and one of the lower rates seen across 2024. Recall that this rate peaked at an 11-month high of 57% in June. One year prior, China represented 50% of global output.
Steel output from the rest of the world (ROW) held steady at 68.5 million mt in December, down less than 1% from December 2023. ROW production averaged 69.5 million mt per month for the year, up slightly from 69.4 million mt per month in the previous year.
Production by country
Looking at production levels by country, India was the second largest steelmaker in December with 13.6 million mt of steel produced. Next up was Japan (6.9 million mt), followed by the United States (6.7 million mt), Russia (5.7 million mt estimated), and South Korea (5.2 million mt).
Looking at 2024 in whole, China produced an estimated 1.0 billion mt of raw steel across the year, 1.7% less than it did in 2023. Indian production was up 6.3% year over year (y/y) to 149.6 million mt. Output from Japan was 84.0 million mt for the year, 3.4% lower than the previous year. United States production totaled 79.5 million mt, down 2.4% y/y. Russian production was estimated to be 7.0% lower in 2024 at 70.7 million mt. Output from South Korean mills totaled 63.5 million mt, down 4.7% from the prior year.


