

Prices

September 22, 2015
NAFTA Has Largest Dip in Steel Demand in 2015 vs. 2014
Written by Peter Wright
The following article was produced for our Premium level members earlier this week. We wanted to share it with our Executive level members as we think it is important and interesting as the world is flooded with excess steel capacity. If you find this article interesting you may be interested in upgrading your membership from Executive to Premium. We can answer any questions that you might have at: info@SteelMarketUpdate.com.
![]() Global steel production in 12 months through August totaled 1.615 billion tonnes with a capacity of 2.3 billion tonnes. Capacity utilization in August was 68.4 percent with a three month moving average (3MMA) of 69.1 percent, down from 71.6 percent in three months through June. China accounted for 50.5 percent of global production in August. Asia as a whole, including India, accounted for 69.0 percent. Production in August on a tons per day basis was 4.275 million tonnes, down from 4.539 in June which was the highest month of the year.
Global steel production in 12 months through August totaled 1.615 billion tonnes with a capacity of 2.3 billion tonnes. Capacity utilization in August was 68.4 percent with a three month moving average (3MMA) of 69.1 percent, down from 71.6 percent in three months through June. China accounted for 50.5 percent of global production in August. Asia as a whole, including India, accounted for 69.0 percent. Production in August on a tons per day basis was 4.275 million tonnes, down from 4.539 in June which was the highest month of the year.
Tons per day declined in July and August. The seasonal pattern evident since the recession is subdued this year. Total August production was 132.535 million tonnes. If we look at the three month moving average and plot it over time, we see that there has been a significant decline in the second half of the year since and including 2010 which usually extends into February of the next year, after which production kicks up rapidly (Figure 1).
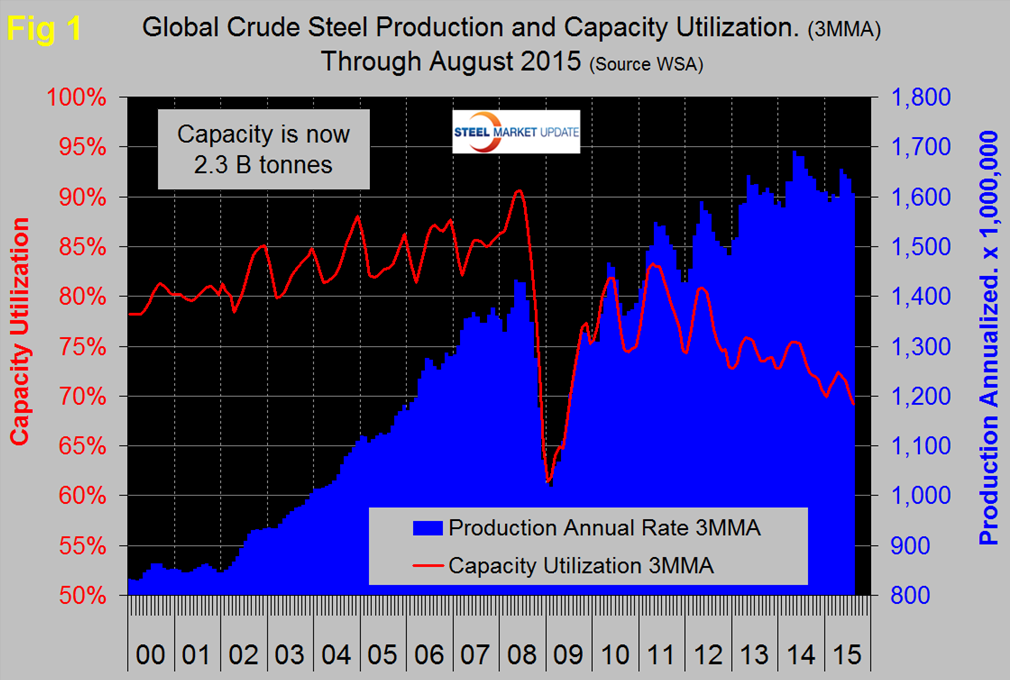
In 2015 the uptick was delayed until May and it is evident that the high point of 2014 won’t be reached this year. As production has increased each year since the recession, capacity utilization has decreased, the gap is widening and has been estimated that surplus capacity is currently as much as 500 million tons per year, well over half of which is in China.
Table 1 shows global production broken down into regions and also the production of the top ten nations in the single month of August and their share of the global total. It also shows the latest three months and twelve months production through August with year over year growth rates for each. Regions are shown in white font and individual nations in beige.
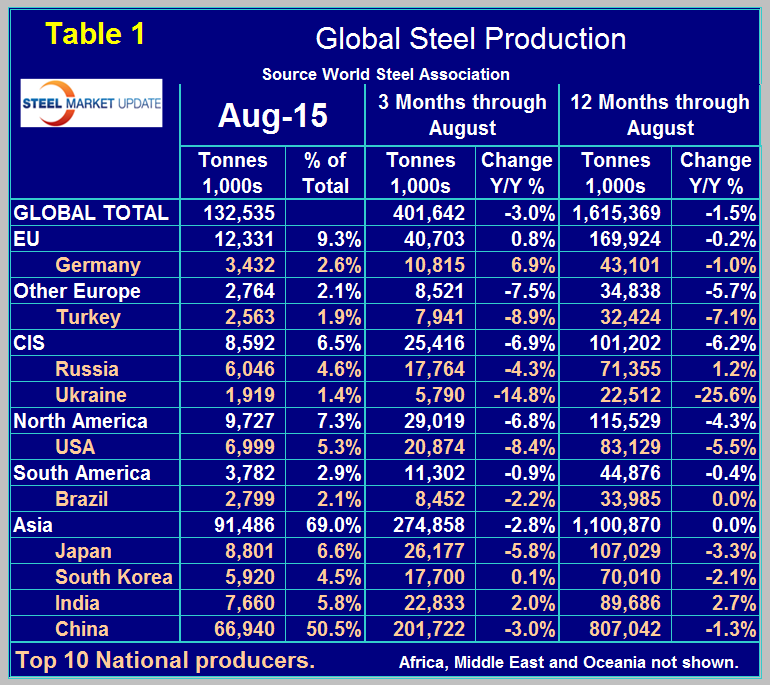
If the three month growth rate exceeds the twelve month we interpret this to be a sign of positive momentum and accelerating growth. The situation this year is the reverse with negative momentum. The world as a whole currently has a negative growth of 3.0 percent in 3 months and negative 1.5 percent in 12 months. The rolling 12 month growth rate in April, May, June, July and August was +0.4 percent, +0.0 percent, -0.3 percent, -1.0 and -1.5 percent respectively.
Clearly the global steel market is slowing. All regions except the EU had negative momentum in the latest data. Comparing the three months through August in 2014 and 2015, the only region to have positive growth was the European Union. The only nations in the top 10 on the same basis to have positive growth were Germany, South Korea and India with 6.9 percent, 0.1 percent and 2.0 percent respectively. In the August data China was down by 3.0 percent in three months year over year, North America was down by 6.8 percent in total with the US down by 8.4 percent, Canada down by 0.8 percent and Mexico down by 3.8 percent. The European Union was up by 0.8 percent and other Europe was down by 7.5 percent led by Turkey down by 8.9 percent. The effect of the war in Ukraine is clear in the contraction of that country’s steel production though the rate of contraction is slowing.
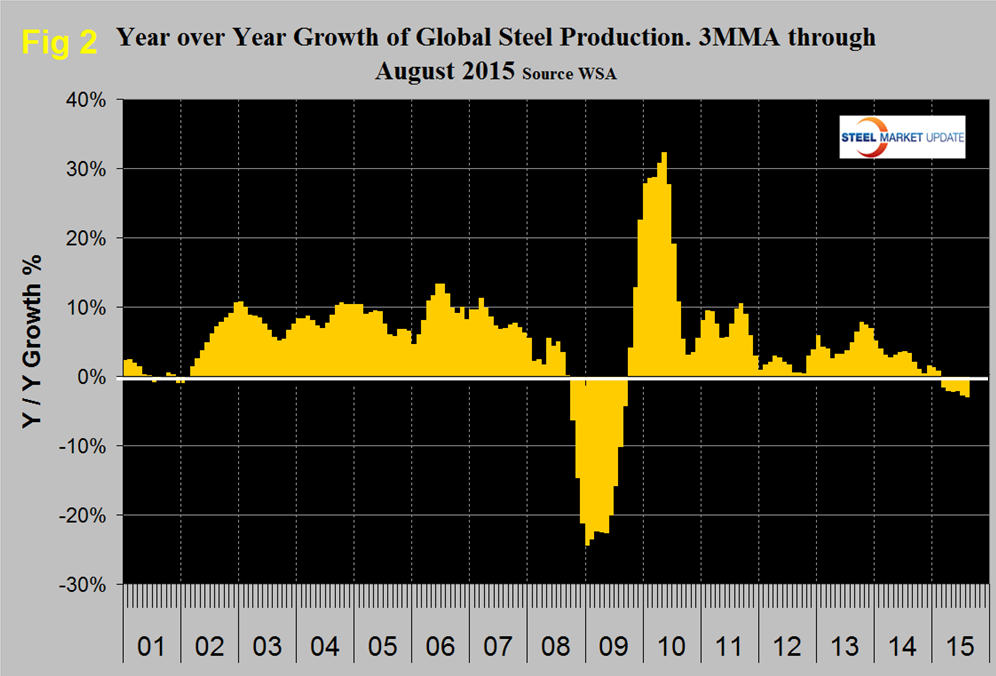
Figure 2 shows the 3MMA of the monthly year over year growth of global steel production which was negative in January for the first time since September 2009. Negative year over year growth has steadily increased from 0.2 percent in January to 3.0 percent in August.
We are again publishing the latest World Steel Association Short Range Outlook forecast for apparent steel consumption in 2015 and 2016 that was released in April. We will leave it in these reports until the next revision is released. The forecast for 2015 continues to looks unrealistically optimistic and that is increasingly the case (Table 2). Note that this forecast is steel consumption, not crude steel production which is the main thrust of what you are reading now.
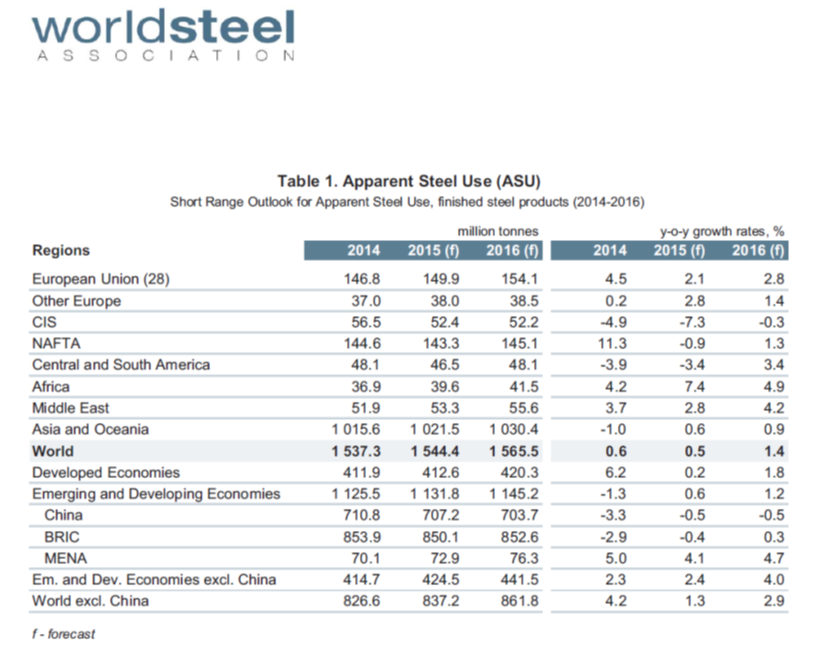
WSA are forecasting a 0.5 percent growth in demand this year followed by 1.4 percent in 2016. Based on this analysis by the WSA, NAFTA has by far the largest deterioration in demand between 2014 and 2015, changing from + 11.3 last year to – 0.9 percent this year. We read the global trends as worse that the WSA forecast suggests. The recent decline in the price of oil, of iron ore and of the Baltic Index suggests that the global economy is weakening. Certainly there is a supply side to all three of those measures but it seems that demand is also down and suggests a further slowdown in global steel production in 2015.
SMU Comment: The appreciating US dollar had had serious consequences for developing nations who have a lot of their debt denominated in dollars. As is now well known the Fed declined to raise interest rates on Thursday. It seems to us that free markets are being suppressed by the Fed’s maintenance of extremely low interest rates over a long period of time but until a couple of weeks ago we had seen no reports in the financial press that supported this view.
Bill Gross who you may remember was the legendary leader of PIMCO until earlier this year wrote the following in early September that we think has huge relevance to the future of global and domestic steel. “The Fed is beginning to recognize that 6 years of zero bound interest rates have negative influences on the real economy – it destroys historical business models essential to capitalism such as pension funds, insurance companies, and the willingness to save money itself. If savings wither then so too does its Siamese twin – investment – and with it, long term productivity – the decline of which we have seen not just in the U.S. but worldwide. But this imbalance between savings/investment and consumption is not the only Frankenstein creation that zero percent yields have created. Over the past 6 years and perhaps on average since the beginning of the 21st century, artificially low yields have propelled financial markets and have impacted the real economy in numerous ways which are not well discussed in the financial press nor certainly in Washington, London, Brussels, or Tokyo. I list them without further elaboration if only because of space constraints; Growth of commodity and non-commodity based economies, currencies and forward yield curves, monetary and fiscal policies, balance of payments/trade balances, debt levels and financial bubbles. Keeping it short in this case is the right policy. The global economy’s finance based spine is so out of whack that it is in need of a major readjustment. In this case, even the best of chiropractors could not even attempt it. Nor would a one off Fed Fund increase straighten it out. Major global policy shifts – all in the same direction – are required that emphasize government spending as opposed to austerity and that recognize that competitive devaluations do nothing but allow temporary respite from the overreaching global problem of “too little aggregate demand” versus “too much aggregate supply.” It is demand that must be increased – yes China must move more quickly to a consumer based economy – but the developed world must play its part by abandoning its destructive emphasis on fiscal austerity, and begin to replace its rapidly decaying infrastructure that has been delayed for decades.”


