

Prices

October 23, 2015
Global Steel Production and Capacity Utilization in September 2015
Written by Peter Wright
Global steel production in 12 months through September totaled 1.613 billion tonnes with a capacity of 2.3 billion tonnes. Capacity utilization in September was 69.3 percent with a three month moving average (3MMA) of 69.1 percent, down from 72.2 percent in three months through April. China accounted for 50.5 percent of global production in September. Asia as a whole, including India, accounted for 68.6 percent. Production in September on a tons/day basis was 4.365 million tonnes, down from 4.518 in April which was the highest month of the year.
![]() The seasonal pattern evident since the recession is subdued this year. Total September production was 130.938 million tonnes. If we look at the three month moving average and plot it over time we see that there has been a significant decline in the second half of the year since and including 2010 which usually extends into February of the next year, after which production kicks up rapidly (Figure 1).
The seasonal pattern evident since the recession is subdued this year. Total September production was 130.938 million tonnes. If we look at the three month moving average and plot it over time we see that there has been a significant decline in the second half of the year since and including 2010 which usually extends into February of the next year, after which production kicks up rapidly (Figure 1).
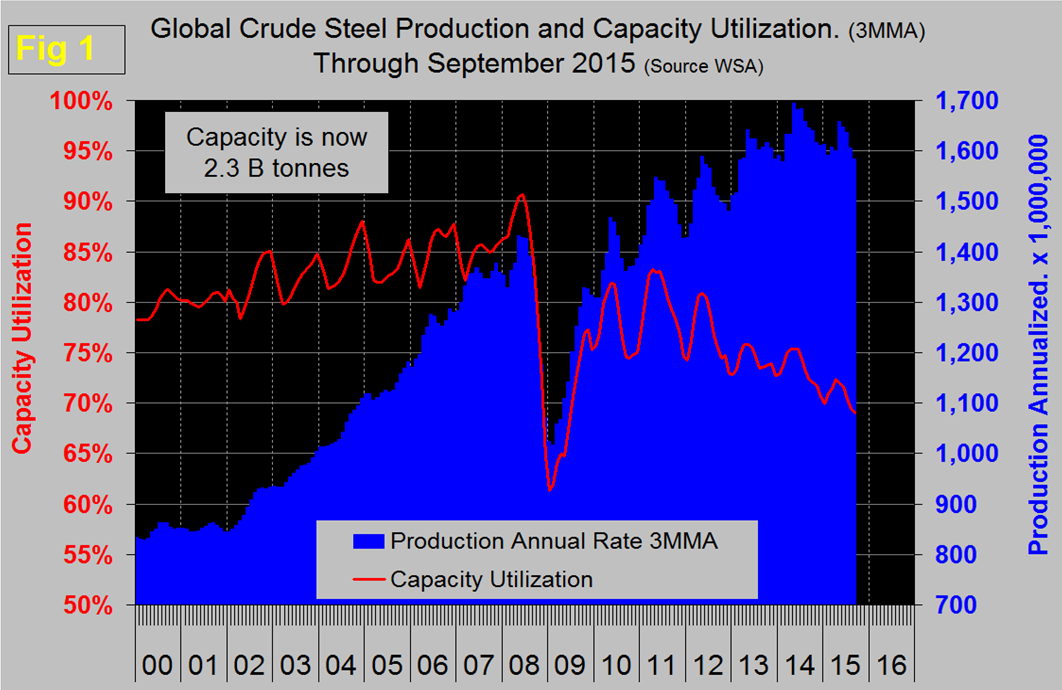
In 2015 the uptick was delayed until April and clearly the high point of 2014 won’t be reached this year. As production has increased each year since the recession, capacity utilization has decreased, the gap is widening. Capacity is estimated to be 2.3 billion tonnes/year, if we assume that the maximum sustainable capacity utilization is 90 percent then effective capacity is 2.07 billion tonnes. This means that excess (unused) capacity in 12 months through September was 2.07 minus 1.61 = 460 million tonnes, well over half of which is believed to be in China. This utilization figure does not bode well for a recovery in global steel prices any time soon.
Table 1 shows global production broken down into regions and also the production of the top ten nations in the single month of September and their share of the global total. It also shows the latest three months and twelve months production through September with year over year growth rates for each. Regions are shown in white font and individual nations in beige.
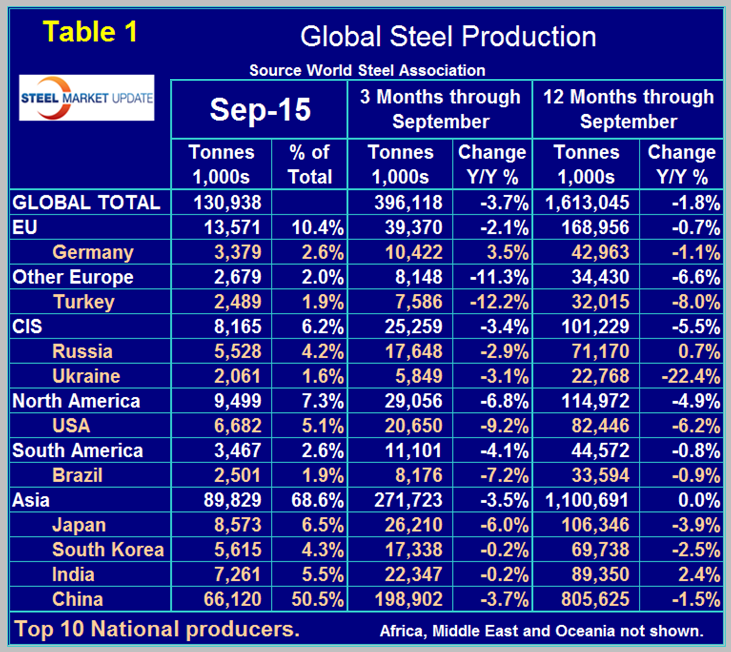
If the three month growth rate exceeds the twelve month we interpret this to be a sign of positive momentum and accelerating growth. The situation this year is the reverse with negative momentum. The world as a whole currently has a negative growth of 3.7 percent in 3 months and negative 1.8 percent in 12 months. The rolling 12 month growth rate in April, May, June, July, August and September was +0.4 percent, +0.0 percent, -0.3 percent, -1.0 percent, -1.5 percent and -1.8 percent respectively. Clearly the global steel market is slowing. All regions except the CIS had negative momentum in the latest data. Comparing the three months through September in 2014 and 2015, all regions had negative growth and the only country to have positive growth was Germany. In the September data China was down by 3.7 percent in three months year over year, North America was down by 6.8 percent in total with the US down by 9.2 percent, Canada down by 0.4 percent and Mexico up by 0.4 percent. The European Union was down by 2.1 percent and other Europe was down by 11.3 percent led by Turkey down by 12.2 percent.
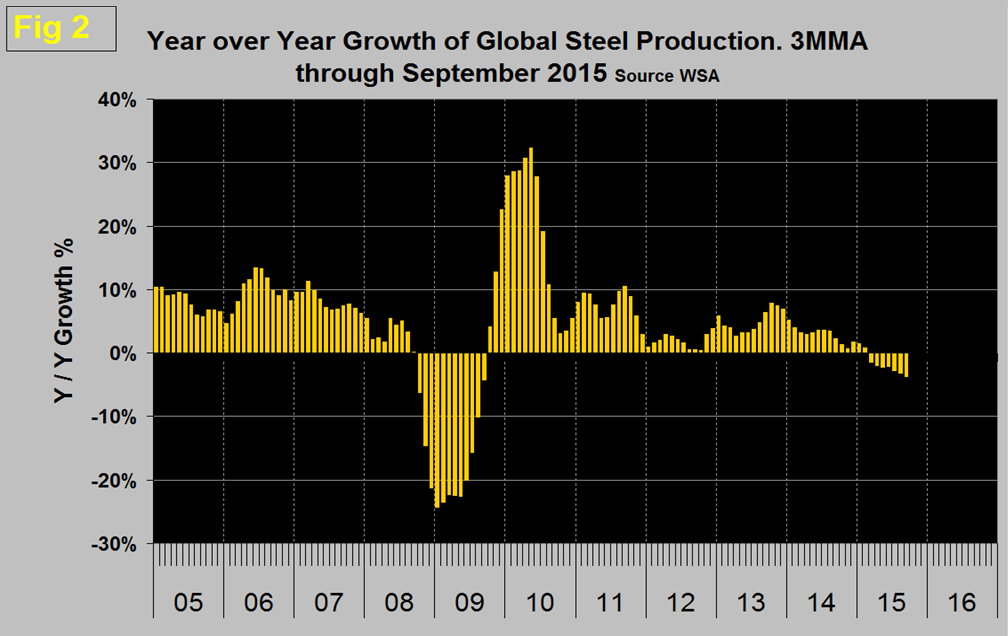
Figure 2 shows the 3MMA of the monthly year over year growth of global steel production which was negative in January for the first time since September 2009. Negative year over year growth has steadily increased from 0.2 percent in January to 3.7 percent in September.
Earlier this month the World Steel Association publishing their latest Short Range Outlook for apparent steel consumption in 2015 and 2016. We include both of their tables here (the first is by region and the second for the top 10 consuming nations):
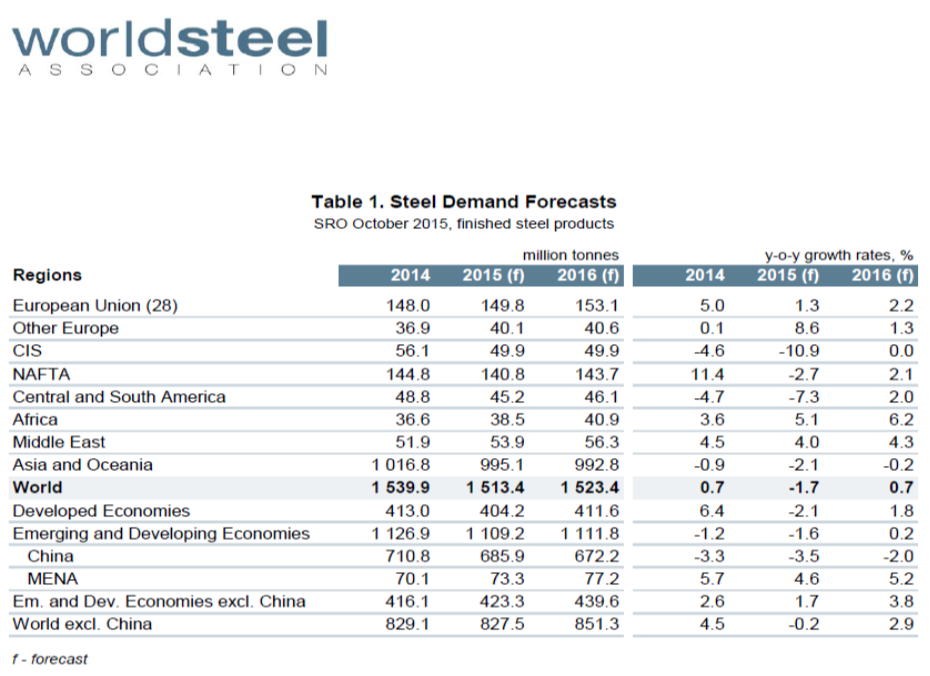
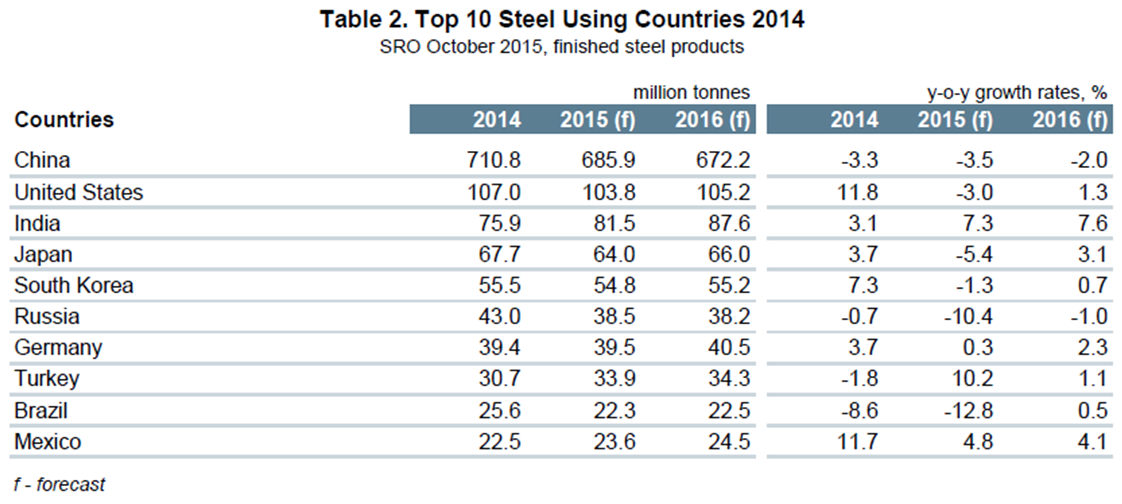
We will leave these in our monthly updates until the April 2016 revision is released. Note that this forecast is steel consumption, not crude steel production which is the main thrust of what you are reading now. At the global level consumption must equal production in the long term with inventory adjustments interfering with that relationship in the short term. WSA are forecasting a 1.7 percent contraction in demand this year followed by a 0.7 percent expansion next year. Based on this analysis by the WSA, NAFTA will decline by 2.7 percent this year and grow by 2.1 percent next year with the US contracting by 3.0 percent and growing by 1.3 percent on the same basis.
SMU Comment: Changes in production and consumption must be proportional in the long term and we think that the WSA forecast continues to be optimistic. They have demand declining at the global level by 1.7 percent this year but production is already down by 1.8 percent in 12 months through September and deteriorating.


