

Market Data

November 2, 2015
Key Market Indicators - October 31, 2015
Written by Peter Wright
An explanation of the Key Indicators concept is given at the end of this piece for those readers who are unfamiliar with it.
The total number of indicators considered in this analysis is currently 36.
Please refer to Table 1 for the view of the present situation and the quantitative measure of trends.
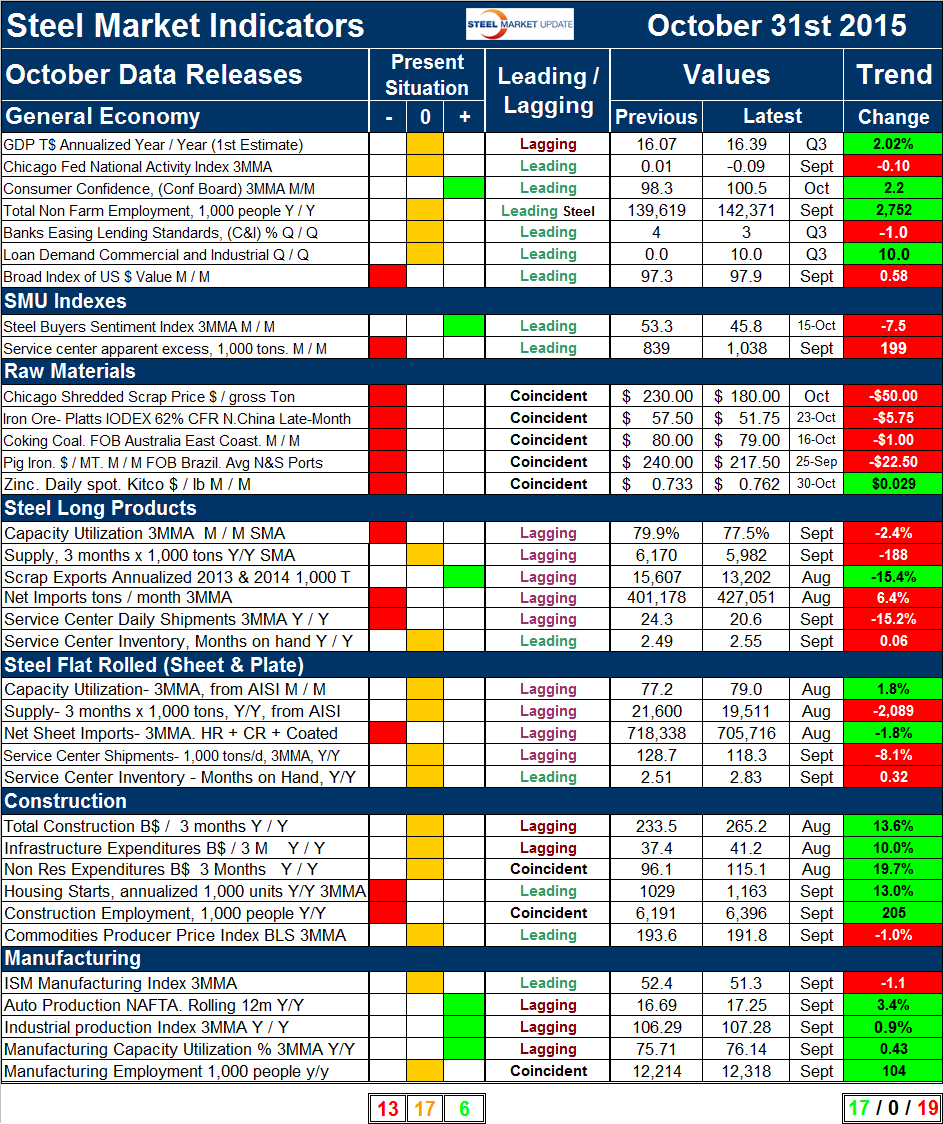
Readers should regard the color codes in the present situation column as a quick look at the current market condition. The “Trend” columns of Table 1, are also color coded to give a quick visual appreciation of the direction in which the market is headed. All data included in this table was released in October, the month or specific date to which the data refers is shown in the second column from the far right and all data is the latest available as of October 31st.
Present Situation
There was no change in our overall evaluation of the present situation based on the October data. We regard 6 of the 36 indicators to be positive, 17 to be neutral and 13 to be negative on a historical basis. However there were four changes in the detail. Consumer confidence broke through 100 in October and we re-classified it from neutral to positive. The capacity utilization of long products fell below 78 percent and we re-classified it from neutral to negative. We now have 5.5 years of this analysis and have graphed the changes in the present situation and trends over time. Figure 1 shows the change in our assessment of the present situation since January 2010 on a percentage basis.
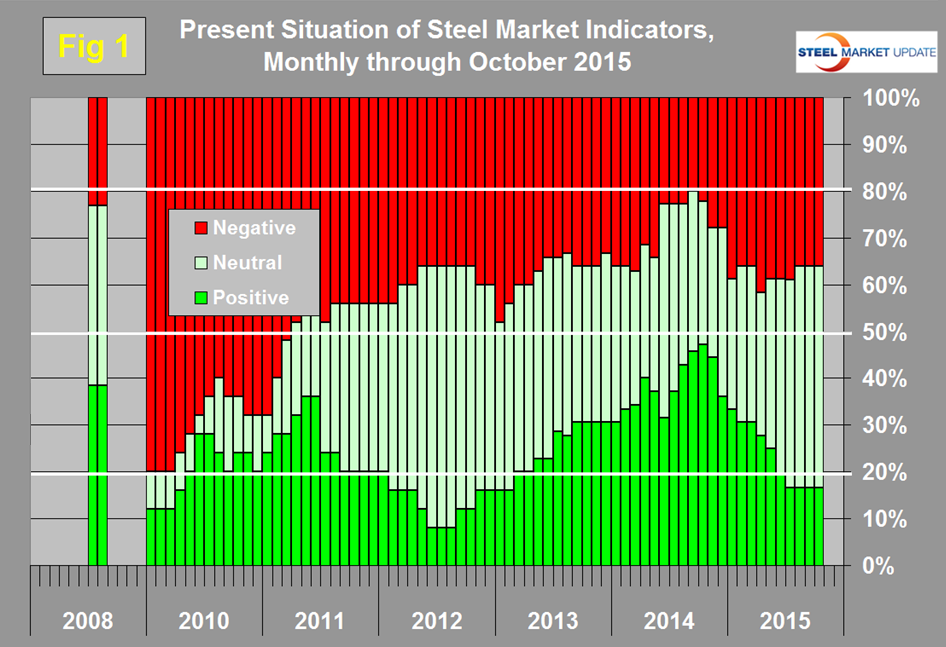
We have also re-created Table 1 for August 2008 before the steel crash of September that year to evaluate whether we should “have seen it coming.” Clearly at that time the present situation was fine and in fact better than it is today. The number of indicators classified as positive peaked at 17 in October last year and has steadily declined to the present value of 6. The first estimate of GDP growth in Q3 was released last week and on a trailing 12 month basis had a growth value of at 2.02 percent, well below the 3.0 percent threshold that we consider to be positive. We still regard the proprietary SMU steel buyer’s index as positive though the situation is deteriorating. All the raw materials prices currently have a negative present situation. The present situation of the long products market is marginally worse than for long products, particularly in terms of service center shipments. The capacity utilization of the long product mills was re-classified to negative from neutral, for the flat roll mills continued to be neutral. This is not an apples and apples comparison because the performance of the long product mills is based on SMA data and of the flat rolled mills on AISI data. There were no changes in our perception of the present situation of the indicators describing the construction industry. In the manufacturing sector the ISM manufacturing index fell below our positive threshold of 52 to reach 51.3 in the September data. A quick visual appraisal of the present situation shows that the general economy is basically neutral. Steelmaking raw materials are historically weak through October’s data. Both steel sectors are neutral to weak. Construction continues to be weak to neutral and manufacturing continues to be neutral to strong. No indicators are currently rated positive in the construction category. None of the manufacturing indicators on a present situation basis are currently negative.
Trends
The number of indicators trending positive through October 31st was 17 which was a decrease of one from our September 27th update, 19 were trending negative. Figure 2 shows the trend of the trends.
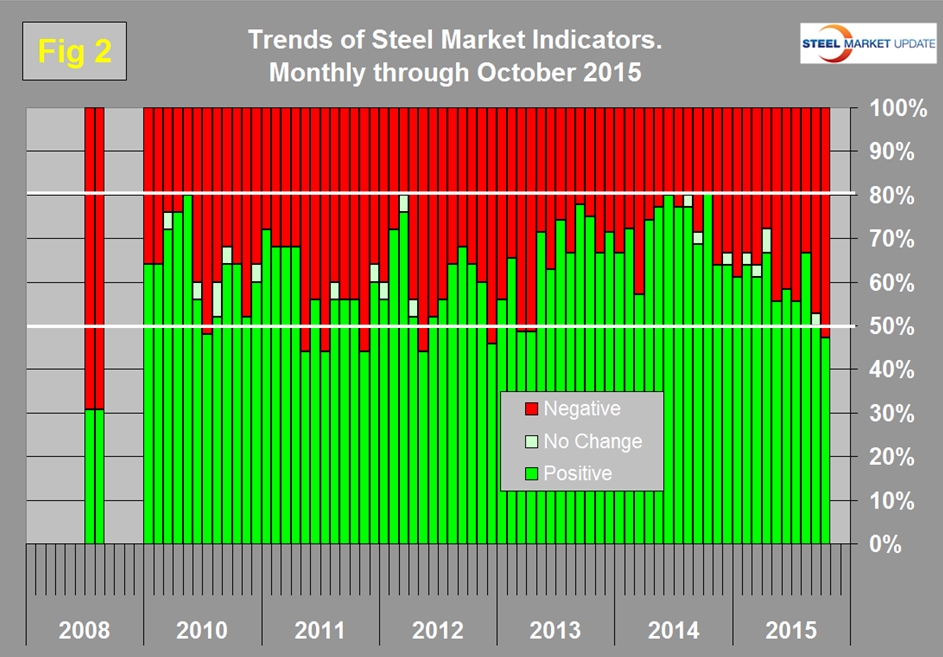
There has been a steady deterioration since the middle of last year and in this latest data the proportion trending positive fell below 50 percent for the first time since March and April 2013. In October last year the proportion trending positive was 80.6 percent which coincided with the highest month of total steel supply since the recession. The question is often asked, “Should we have seen the September 2008 disaster coming?” The answer based on this analytical technique is a definite “Yes” though of course we could have had no idea how bad it was going to be. In August 2008 over 2/3 (69.2 percent) of our indicators were trending negative.
Changes in the individual sectors are described below. (Please note in most cases this is not October data but data that was released in October for previous months.)
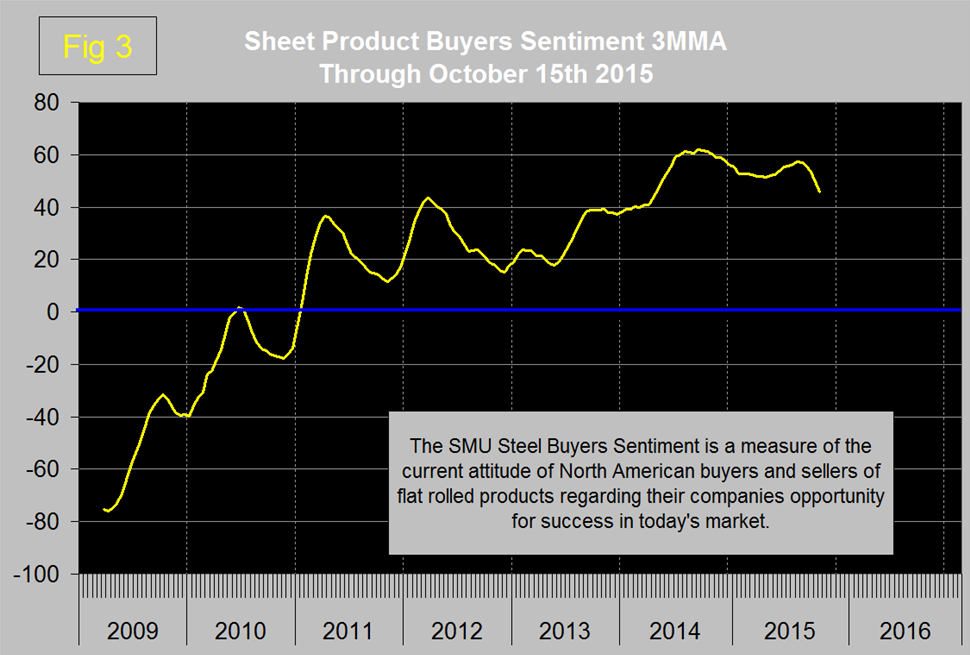
There were no changes to the direction of trends in the general economy. The trends of the two Steel Market Update proprietary indicators also maintained the same negative direction and in both cases the declining trend accelerated. The three month moving average of steel buyer sentiment declined to 45.8 on October 15th but as shown in Figure 3 is still at a historical high level.
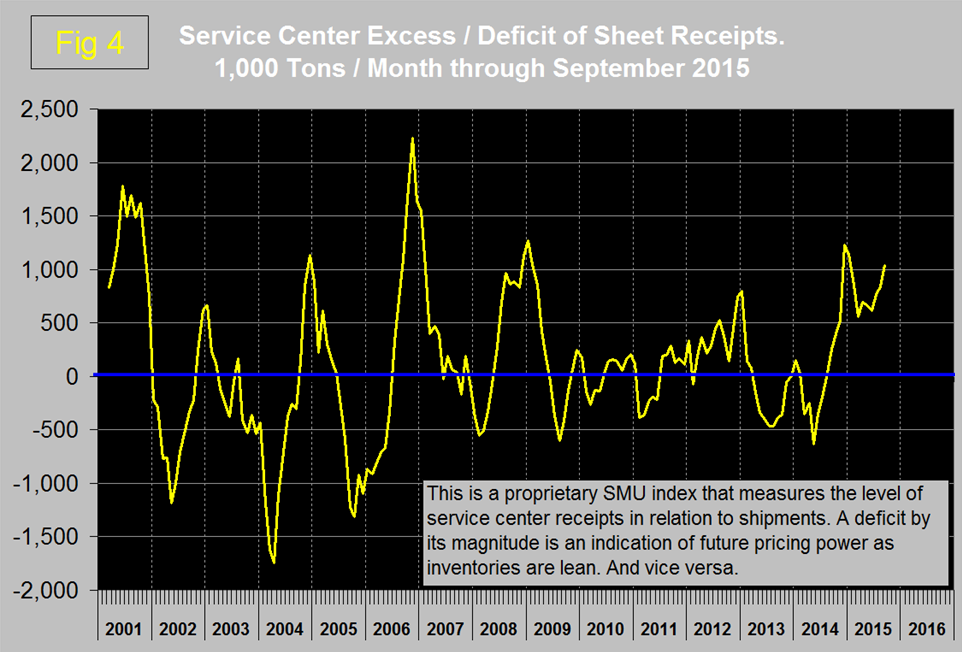
Service center excess which increased to 767,000 tons in August increased again to 1,038,000 tons in September. We regard this as indicative of weak pricing power going forward (Figure 4).
In the steel raw materials section, the Platts IODEX iron ore price delivered N. China which had a small reprieve in September declined again in October. The Kenco spot price of zinc which had been declining since April 30th had a small price increase in October. In July we stated that, “We expect scrap prices to take another hit when the data is released by AMM in the next couple of weeks,” and this occurred with a $35 decrease in Chicago shredded in August. In August we stated that based on our benchmark indicators we think scrap is still high.” In October prices declined a further $50 per gross ton. In the immediate future we expect scrap to take a breather. In the long product section, capacity utilization and net imports both reversed direction and trended negative. In the flat rolled sector net imports trended down (positive) in the August data. This is the latest month available because the calculation is partly based on the AISI steel shipment numbers. The long products numbers are based on data from the SMA who get their data out faster than the AISI. There was no change in construction or manufacturing trends. Both with only one exception each are trending positive.
We believe a continued examination of both the present situation and direction is a valuable tool for corporate business planning.
Explanation: The point of this analysis is to give both a quick visual appreciation of the market situation and a detailed description for those who want to dig deeper. It describes where we are now and the direction in which the market is headed and is designed to give a snapshot of the market on a specific date. The chart is stacked vertically to separate the primary indicators of the general economy, of proprietary Steel Market Update indices, of raw material prices, of both flat rolled and long product market indicators and finally of construction and manufacturing indicators. The indicators are classified as leading, coincident or lagging as shown in the third column.
Columns in the chart are designed to differentiate between where the market is today and the direction in which it is headed. Our evaluation of the present situation is subjectively based on our opinion of the historical value of each indicator. There is nothing subjective about the trends section which provides the latest facts available on the date of publication. It is quite possible for the present situation to be predominantly red and trends to be predominantly green and vice versa depending on the overall situation and direction of the market. The present situation is sub-divided into, below the historical norm (-) (OK), and above the historical norm (+). The “Values” section of the chart is a quantitative definition of the market’s direction. In most cases values are three month moving averages to eliminate noise. In cases where seasonality is an issue, the evaluation of market direction is made on a year over year comparison to eliminate this effect. Where seasonality is not an issue concurrent periods are compared. The date of the latest data is identified in the third values column. Values will always be current as of the date of publication. Finally the far right column quantifies the trend as a percentage or numerical change with color code classification to indicate positive or negative direction.


