Market Data

November 30, 2015
Service Center Apparent Excess Results & Forecast
Written by Brett Linton
As part of your Premium level service, Steel Market Update (SMU) analyzes the service center shipment and inventory data and provides a short term forecast for carbon flat rolled steel shipments, inventories and how they will impact pricing over the next four months. This is done through a proprietary model and the results provided are called the Service Center Apparent Excess/Deficit forecast.
First, we want to take a moment to discuss what we did right and wrong with our previous month forecast.
For the month of October SMU forecast shipments would be 2,218,000 tons of carbon flat rolled steel. Our forecast was based on our model suggesting shipments would be 8 percent lower than October 2014 shipment levels.
Actual shipments were 5,400 tons less than our forecast so, we would say we were essentially right on the mark with our shipment forecast for the month of October.
Flat rolled inventories were forecast to be 6,065,000 tons which was based on the previous 3 month moving average. Actual inventories came in 234,300 tons lower than our forecast with receipts averaging 96,109 tons per day which is the lowest level seen since March 2015.
Based on our Apparent Excess/Deficit model we have October as having 1,024,000 tons in excess of what our model considers “balanced” inventories for this time of year and business conditions. Our original forecast was for the excess to grow to 1,252,000 tons.
The good news is we missed the inventory number, which is a good sign that distributors are taking their inventories down which will ultimately lead to renewed buying if the trend continues.
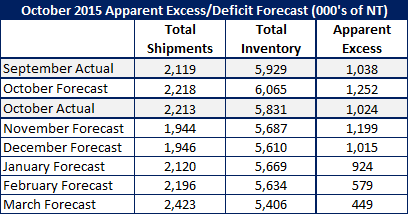
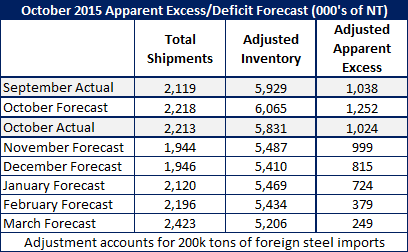
Our new forecast calls for shipments to be 1,944,000 tons for the month of November and that carbon flat rolled inventory will drop to 5,687,000 tons at US service centers.
Our Apparent Excess will rise due to the industry being at the end of the year (when shipments tend to slow over the Holidays). However, our forecast calls for the Apparent Excess to shrink in January, February and March.
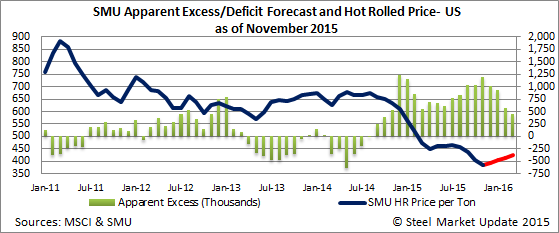
SMU opinion is with lead times already being into first quarter on many flat rolled products coupled with slowing imports of hot rolled, cold rolled, galvanized and Galvalume (which is difficult to build into our model but could have as much as a 200,000 to 300,000 positive impact on inventories beginning in November and potentially building from there. If correct, this would put the service centers into a need to buy mode earlier than suggested by the table below) we could see prices bottom prior to the beginning of January and prices rising from that point. We have made a foreign steel adjustment of -200,000 tons for each month in a second table shown below.