

Market Data

December 3, 2015
Steel Mill Lead Times Treading Water with Little to No Change
Written by John Packard
The following lead times are averages generated out of the flat rolled steel market analysis we conducted beginning on Monday of this week. Actual mill lead times will vary from mill to mill and we always recommend that buyers speak to their mill representatives in order to obtain the most up to date lead times for that mill.
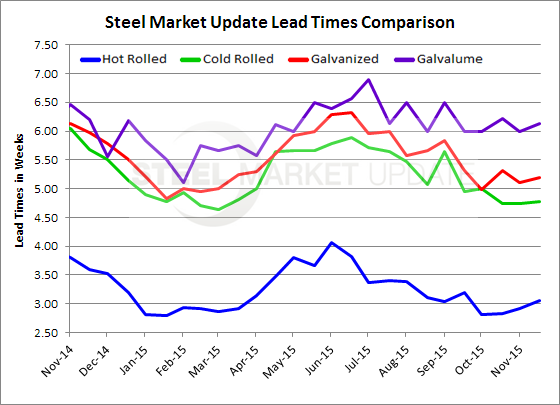
Those responding to our inquiry regarding hot rolled lead times reported a 3 week average which is essentially unchanged over the past few months. Last year at the beginning of December HR lead times averaged 3.5 weeks.
Cold rolled lead times averaged at 4.78 weeks again, essentially unchanged from what we have been reporting for the past few months. In early December 2014 CR lead times averaged 5.68 weeks.
Galvanized lead times average just over 5 weeks (5.20) which is where we have seen them over the past few months. One year ago GI lead times were at 6.0 weeks.
Galvalume lead times were reported to be averaging just over 6.0 weeks (6.13) which is in line with the 6.20 weeks reported one year ago.
It is our opinion that lead times will be one of the early signs of change which may lead to a spark and move steel prices off the current levels.
To see an interactive history of our Steel Mill Lead Time data, visit our website here.


