

Prices

January 19, 2016
Hot Rolled Sheet Price Relationships
Written by Peter Wright
This article is normally reserved for our Premium members but we felt it would be a good one to share with all of our readers. If you are interested in signing up for a Premium membership or would like a trial, let us know at info@SteelMarketUpdate.com or call (800) 432 3475.
Following up on our piece on scrap price relationships we decided to take a look at hot rolled sheet on a similar basis. The best benchmark we have ever found for the price of scrap is the price of West Texas crude in Cushing, Oklahoma for which the correlation since 1990 has been almost 0.94 or 94 percent.
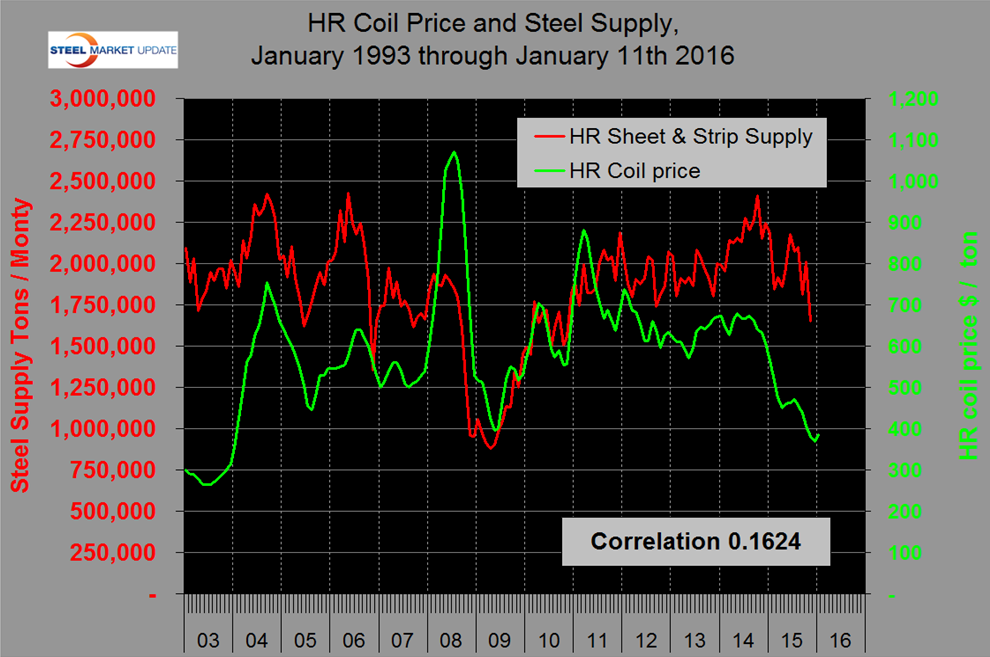
To get us started, we examined the relationship between price and monthly supply of hot rolled sheet which is a proxy for demand. Supply is defined as shipments by domestic mills to domestic locations plus imports. Figure 1 shows the two data streams superimposed with a very low correlation of 0.1624. Not surprisingly, price is very much more volatile than supply as a shortfall or surplus gets magnified during commercial negotiations.
During this investigation we came across a leading index for steel demand produced by the US Geological Survey. The USGS do basic analysis into the mineral and metals industries which they don’t publicize very well. Figure 2 shows the relationship between the price of hot rolled sheet and the USGS leading index with a correlation of 0.4017.
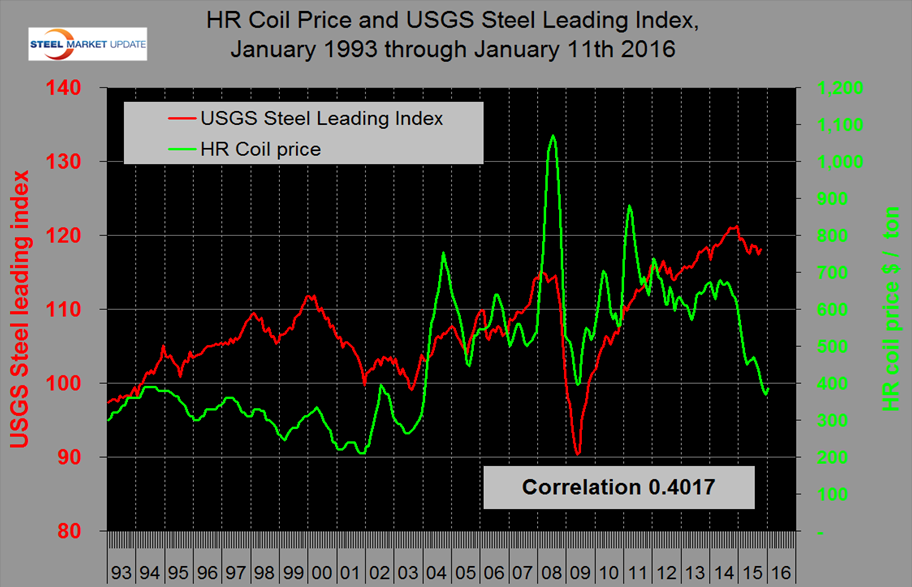
At the end of this piece we show the components of this index which seem to be well thought out and was developed by the former Center for International Business Cycle Research (CIBCR) at Columbia University. Even though this correlation isn’t very good, if we interpret the graph correctly, there is some interesting history there. In the second half of the 1990s the index and prices moved in opposite directions which we interpret as the effect of the thin slab/EAF revolution that began at Nucor’s Crawfordsville plant in 1995. There was a sharp price increase in 2004 resulting from disruption of supply from the integrated plants. This resulted from the shortage of coking coal which was due to a fire in a major West Virginia mine. In 2009 prices didn’t crash by as much as might have been expected as mills voluntarily cut production and avoided a race to the bottom. In 2014 and 2015, the price of sheet was driven down by imports. Figure 3 shows the relationship between the USGS Coincident index and hot rolled sheet supply with a correlation of 0.6916 since January 2003 and 0.9388 since September 2008.
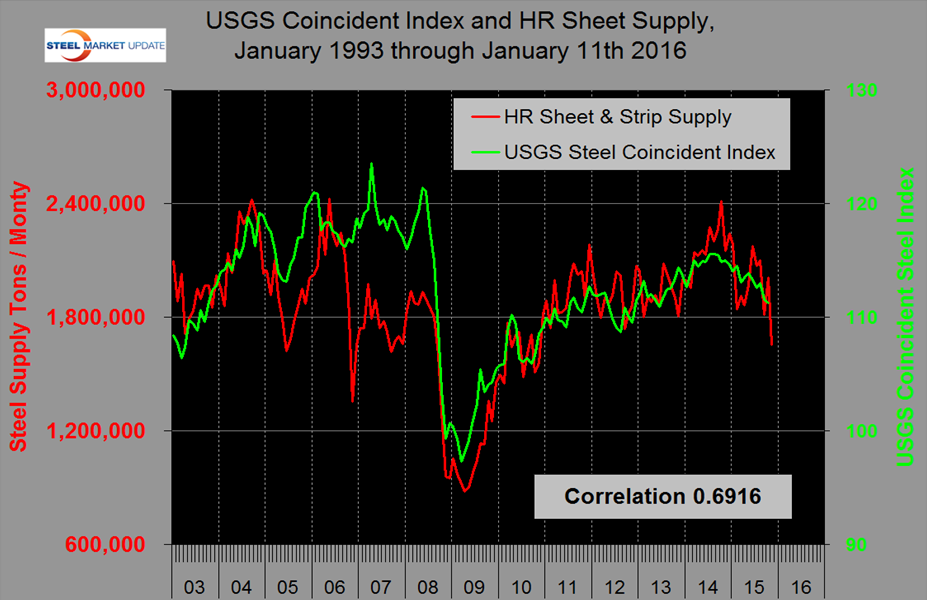
All the SMU benchmarks for steel demand tell the same story. Considering that manufacturing is strong (though slowing) and construction is growing rapidly, steel demand should be much stronger than it is today. This is particularly true for long products but also for hot rolled sheet and this shows up in H2 2015 of Figure 3. We interpret this shortfall as due to inventory reduction throughout the supply chain.
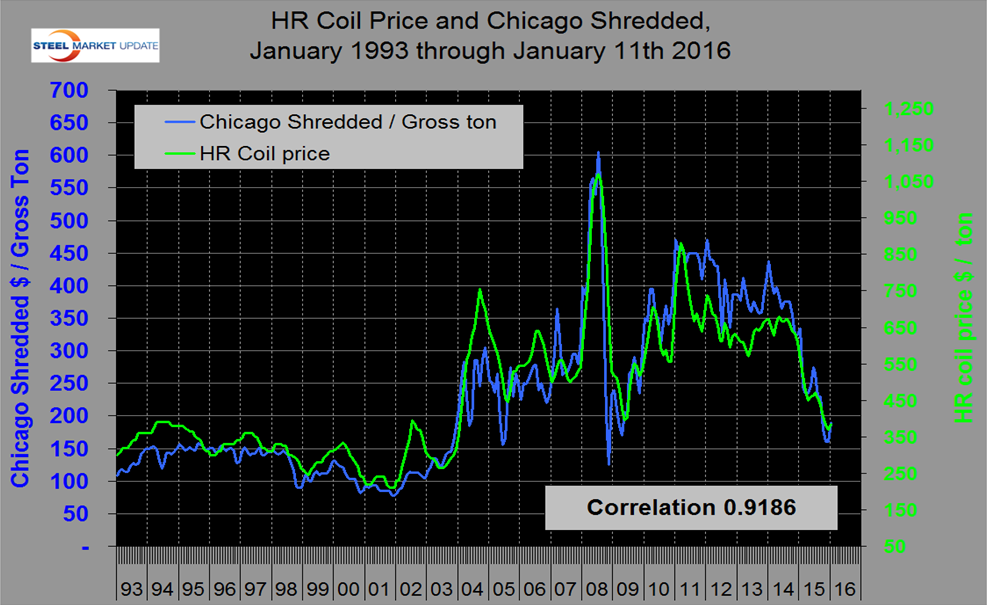
There is a highly correlated relationship between the price of hot rolled sheet and Chicago shredded with no discernible lead or lag as shown in Figure 4. Since 1993 the correlation has been 0.9186 and this was in place even before the thin slab revolution began.
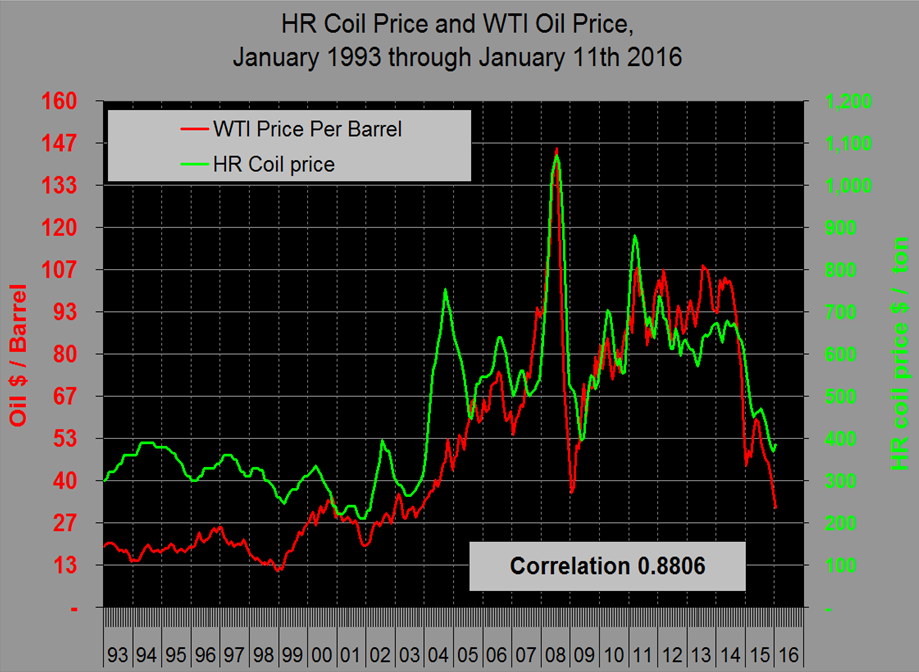
Our analysis of the relationships between the prices of scrap, iron ore and oil were reported earlier with a scrap to oil correlation of 0.9378 since 1990. This oil scrap relationship has been impervious to political upheavals in the Middle East throughout the last 26 years. At the present time scrap is overpriced based on this relationship. Given the scrap to hot rolled price relationship and the scrap to oil relationship it naturally follows that there should be a high correlation between hot rolled sheet and oil prices and this is the case as shown in Figure 5 with a correlation of 0.8806. Unfortunately, these historical trends/benchmarks suggest that the downside for both scrap and hot band prices is currently higher than the upside.
USGS Leading Index
1. Average weekly hours, iron and steel mills (NAICS 3311 & 3312)
2. New orders, iron and steel mills (NAICS 3311 & 3312), 1982$
3. Shipments of household appliances, 1982$
4. S&P stock price index, steel companies|
5. Retail sales of U.S. passenger cars and light trucks (units)
6. Growth rate of the price of steel scrap (#1 heavy melting, $/ton)
7. Index of new private housing units authorized by permit
8. Growth rate of U.S. M2 money supply, 2009$
9. PMI


