

Prices

February 9, 2016
Foreign Steel Imports Analysis for Major Trading Countries
Written by John Packard
With the release of the December 2015 Final Census data we thought our readers would like to see not only how imports have fared over the past few years but, how those who are the largest exporters fared as well as those who are involved in the hot rolled, cold rolled and CORE (corrosion resistant) trade cases.
What we have done is to review the last five years of data for hot rolled, cold rolled and galvanized steels. We break out the totals and then we review the largest exporters of each product to the United States. Separately, we have the data as to what percentage each country represents of the total. We also made sure we included each country that was part of the original trade case by product.
Hot Rolled
For hot rolled we have three countries who are not part of the trade suit included in the data as they have been or are major exporters of HRC to the United States within the past five years. Canada, Mexico and Russia are not involved with the HRC antidumping and countervailing trade suits. In the case of Russia, its exports have been part of a “Suspension Agreement” which was ended approximately one year ago.
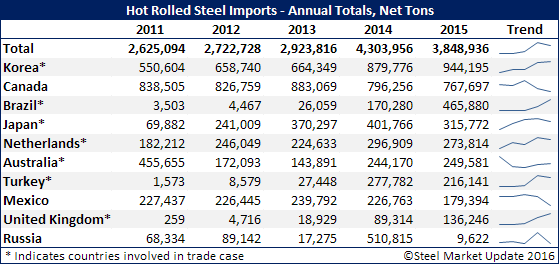
Of the countries listed above we have provided their percentage of the total HRC market for calendar year 2015 below:
Korea* 24.5%
Canada 19.9%
Brazil* 12.1%
Japan* 8.2%
Netherlands* 7.1%
Australia* 6.5%
Turkey* 5.6%
Mexico 4.7%
UK* 3.5%
Russia 0.2%
These countries represent 92.5% of total HR 2015 imports.
We learned earlier today that approximately half of the Brazilian hot rolled shipments during calendar year 2015 went to the CSN Terre Haute facility to be re-rolled into cold rolled and galvanized steels.
Cold Rolled
We did the same analysis with cold rolled imports as we looked at the entire year and then compared 2015 against the previous 4 years. As you can see 2015 CR imports were almost exactly the same as 2013.
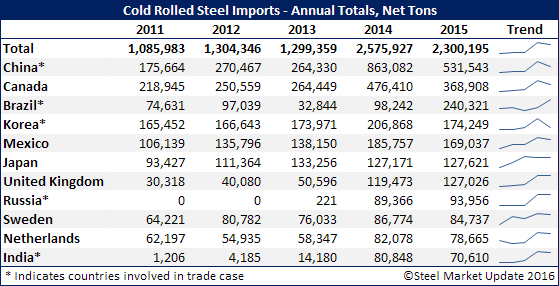
Next, you can start to think about what countries will be out of the market due to the dumping suits which will be resolved during the first seven months 2016.
Based on Preliminary countervailing duties China should become a non-factor in the cold rolled market. The others will all be determined as to how high any final duties might be. One of the traders told us that their mill supplier would not be a player in the U.S. market if the duties (AD + CVD combined) total 10 percent or higher.
Here are the percentages each country represented of the total for calendar year 2015:
China* 23.1%
Canada 16.0%
Brazil* 10.4%
Korea* 7.6%
Mexico 7.3%
Japan 5.5%
UK 5.5%
Russia* 4.1%
Sweden 3.7%
Netherlands 3.4%
India* 3.1%
These countries represent 89.8% of total CR 2015 imports
Cold rolled Antidumping (AD) preliminary determination is scheduled to be released later this month.
Galvanized
Galvanized imports grew during 2015 versus the previous year. As you can see by the table below, GI imports have grown each year with 2014 becoming the watershed moment as imports exceeded 3 million net tons.
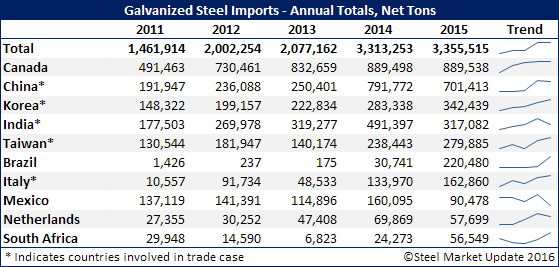
As with cold rolled we expect China will be a non-factor in 2016 galvanized imports. However, unless there is a change and the duties go much higher then we expect Korea, India, Italy and Taiwan to continue to be players in the domestic markets. Brazil is growing and is not part of the dumping suits. All of this could change should the US Department of Commerce and the International Trade Commission place higher duties on galvanized from Korea, India, Italy and Taiwan.
Here are the percentages of the 2015 total each country was responsible for:
Canada 26.5%
China* 20.9%
Korea* 10.2%
India* 9.4%
Taiwan* 8.3%
Brazil 6.6%
Italy* 4.9%
Mexico 2.7%
Netherlands 1.7%
South Africa 1.7%
These countries represent 92.9% of total GI 2015 imports


