

Prices

April 20, 2016
Global steel production and forecast through 2017
Written by Peter Wright
Source World Steel Association with analysis by SMU.
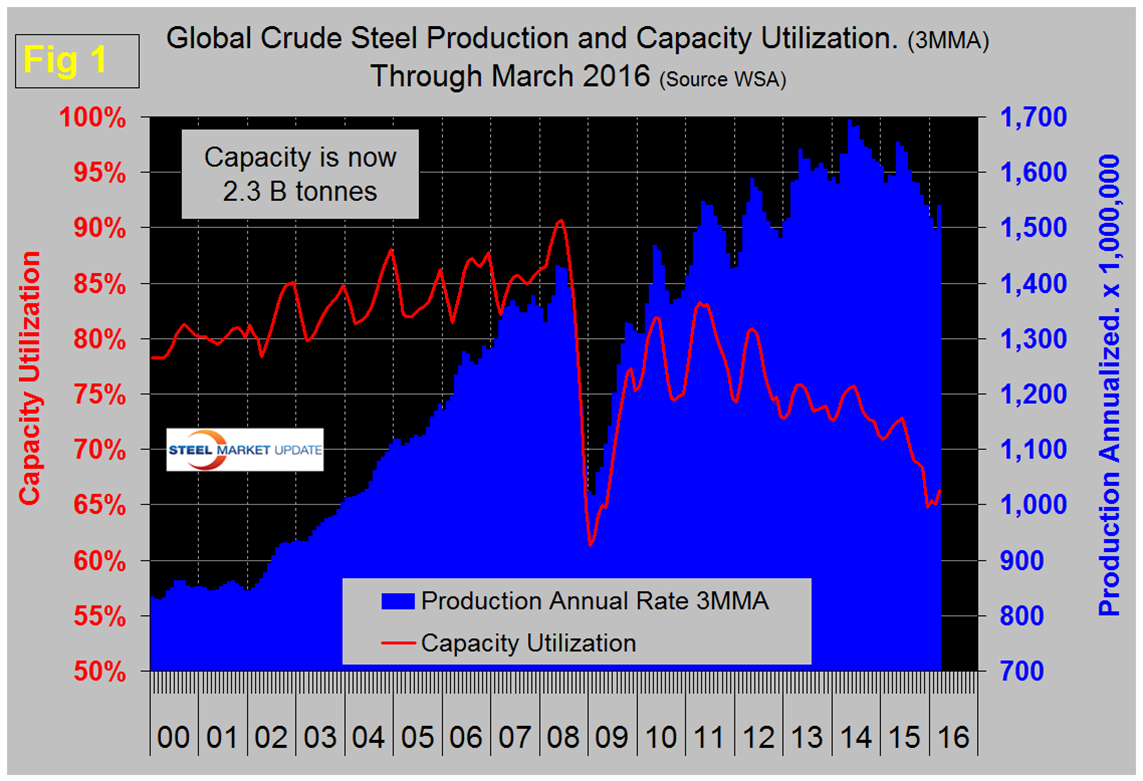
Global steel production in the 12 months of 2015 totaled 1.595 billion tonnes with a capacity of 2.33 billion tonnes. The WSA has made no downward revision to capacity as production fell in the course of 2015 through February this year making capacity utilization look increasingly dismal. Production in the month of March surged to 137,472,000 tons, up from 121,000,000 in February. On a tons / day basis production in March was 4.434 million tonnes which was the highest level since May last year. If we look at the three month moving average and plot it over time we see that there has been a significant decline in the second half of the year since and including 2010 which then picks up in January and February, (Fig 1).
In 2015 the uptick was delayed until April and the high point of 2014 was not reached in 2015. Figure 2 shows the average monthly production by month in the 8 years since 2008. On average March has been up by 0.71 percent from February but this year March was up by 6.3 percent.

What actually happened was that the start of year surge was delayed as January and February expanded by less than normal. In the first quarter daily production grew by 8.8 percent this year compared to an eight year average of 9.7 percent. As production has increased each year since the recession, capacity utilization has decreased, the gap is widening. Capacity utilization in three months through March was 66.3 percent, down from 72.3 percent in three months through June. China accounted for 51.4 percent of global production in March, up from 48.6 percent in February. Asia as a whole, including India, accounted for 69.2 percent in March. China continues to state that redundant capacity will be closed and that the central government will provide support in the form of funding for re-assigned workers and for asset write-offs. If the WSA is keeping up with the situation, which we assume they are, then no actual capacity has been shuttered or if it has then new capacity has replaced it.
On Monday Reuters reported that at the OECD steel summit, China and other major steel-producing countries failed to reach a deal to tackle global steel overcapacity, as the sides argued over the causes and whether China is keeping loss-making producers afloat. The OECD meeting was attended by officials from 34 countries, representing 93 percent of the world’s steel production. The talks had, among other things, been meant to “reduce trade frictions among trading partners.” China’s assistant commerce minister denied that his country subsidizes steel exporters, saying China had cut 90M metric tons of capacity and had plans to reduce it by another 100M-150M, while critics say it would still have a capacity of ~1B metric tons, far in excess of its needs.
Table 1 shows global production broken down into regions and also the production of the top ten nations in the single month of March and their share of the global total. It also shows the latest three months and twelve months production through March with year over year growth rates for each. Regions are shown in white font and individual nations in beige.

If the three month growth rate exceeds the twelve month we interpret this to be a sign of positive momentum and accelerating growth. The situation currently is that momentum is flat, a welcome change from the negative momentum that existed since February 2014. The world as a whole currently has a negative growth of 3.5 percent in 3 months and also negative 3.5 percent in 12 months through March. All regions, except other Europe (mainly Turkey), had negative growth in the latest data. On a single country basis, of the top ten producers only Turkey, India and Ukraine had positive year over year growth in the 3 months through March. In the March data China was down by 2.7 percent in three months year over year, North America was down by 0.9 percent in total with the US down by 1.3 percent, Canada up by 10.6 and Mexico down by 6.6 percent. The European Union was down by 7.2 percent and Asia was down by 2.8 percent.
Figure 3 is the most succinct description of the change in growth rate since January 2005. It shows the 3MMA of the monthly year over year growth of global steel production. This became negative in March 2015 for the first time since September 2009 and improved from negative 5.9 percent in January to negative 3.5 percent in March.

The October version of the World Steel Association Short Range Outlook, (SRO) for apparent steel consumption in 2015 and 2016 had last year contracting at 1.7 percent and 2016 growing at 0.7 percent. What actually happened was that consumption contracted by 3.2 percent in 2015. This month, (April) the WSO updated its forecast. (Note this forecast is steel consumption, not crude steel production which is the main thrust of what you are reading now.) Figure 4 is a geographical view of production and growth in 2016 followed by Table 2 which shows the expectations by country and region. The new WSA forecast has global consumption in 2016 contracting at 0.8 percent and in 2017 growing at 0.4 percent. Based on this forecast, NAFTA will grow by 3.2 percent this year and 2.6 percent next. China will decline by 4.0 percent this year and 3.0 percent in 2016.


SMU comment; China seemed to take a very bellicose attitude at the OECD talks in spite of having made recent statements about plant closures. China is exporting far more than the US produces, a situation that is not likely to change in the short term as they play the game of shipping to destinations of least resistance. The relatively low price of ore compared to scrap is helping the competitive position of the Chinese integrated producers. The WSA forecast for 2015 published last October had demand declining at the global level by 1.7 percent when through December it was actually down by 3.2 percent. The April forecast has 2016 contracting by 0.8 percent which by our reckoning, since the decline has been accelerating this year, will take a turnaround for 2016 not to be worse than the forecast.


