

Market Data

April 24, 2016
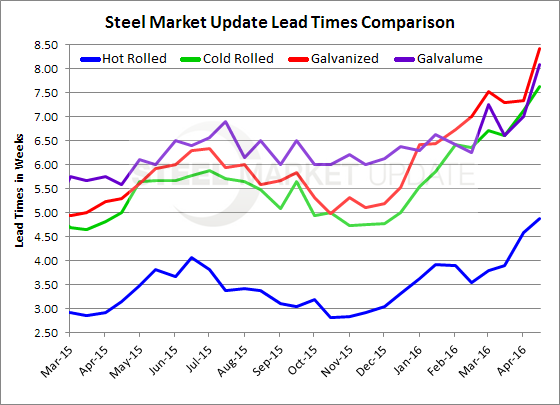
Steel Mill Lead Times Now Averaging 1-3 Weeks Longer than One Year Ago
Written by John Packard
According to our latest flat rolled steel market survey which was conducted last week, steel mill lead times have continued to move out on every single one of the flat rolled products. The extended mill lead times are one of the primary reasons behind the increases in flat rolled steel prices, pressure on deliveries, allocations existing at certain mills on certain products and the need by many steel buyers to adjust buy schedules in light of the new lead times.
Hot rolled lead times are now being reported as averaging 4.87 weeks. This is an increase of almost one full week compared to one month ago and is almost two weeks longer than what we reported one year ago. HR lead times are now the most extended since the middle of May 2014 when we reported HRC lead times as averaging 4.91 weeks.
Cold rolled, just like hot rolled, is now averaging one week longer than what we reported one month ago and is more than 2.5 weeks longer than one year ago. CR lead times are the most extended since mid-April 2014 when we reported CRC lead times as averaging 7.84 weeks.
Based on our survey results, galvanized lead times are now averaging 8.42 weeks, more than one week longer than one month ago and almost three weeks longer than one year ago. The 8.42 weeks is the most extended lead time we have ever reported based on our survey results.
Galvalume lead times are also extended now being reported as averaging 8.08 weeks, almost 1.5 weeks longer than one month ago and 2.5 weeks longer than one year ago. This is also the longest lead time we have ever reported for Galvalume.
To see an interactive history of our Steel Mill Lead Time data, visit our website here.


