

Market Data

May 10, 2016
SMU Survey Respondents Weigh in on When this Price Cycle Breaks
Written by John Packard
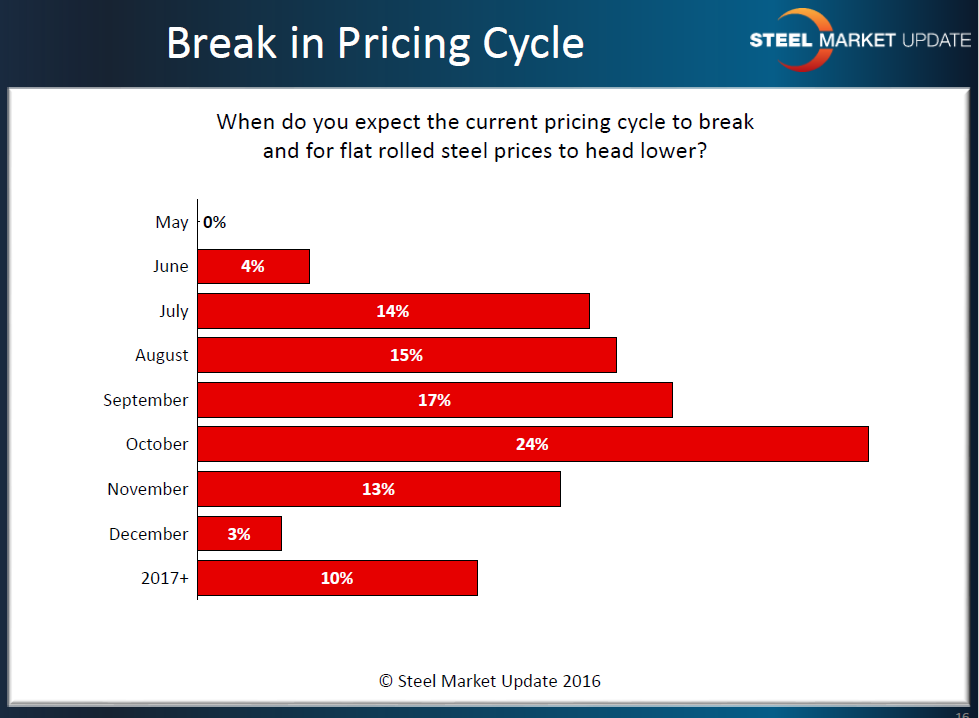
Last week SMU asked those responding to our flat rolled steel market trends questionnaire about when they expected a break in the current flat rolled steel pricing cycle and for prices to begin heading lower. There was no consensus as 50 percent of those responding felt the change would occur prior to the 4th Quarter 2016 and the other 50 percent were in the camp that it would take until at least October or beyond.
The one month getting the most attention was October with 24 percent of the respondents. The graphic below depicts how active buyers and sellers of flat rolled steel see the life of this current “up” pricing cycle we are in:
Our Respondents Comments:
We received a number of comments associated with this question. Here are some examples:
“Excellent question. So many variables but if pushed to guess I would suggest q1 of 2017.” Service center
“When imports start to climb again and some additional capacity comes back into the market as it did in China in March and April.” Manufacturing company
“This type of rapid run up never last.” Service center
“You will know – when lead times drop, prices will follow.” Manufacturing company
“Flat August down September.” Manufacturing company
A trading company that told us October would be the timing for a change in pricing direction added this comment: “It may be sooner, if they continue raising.”


