

Market Data

May 22, 2016
SMU Survey: More Flat Rolled Price Pressure to Come
Written by John Packard
Twice per month Steel Market Update (SMU) conducts our flat rolled steel market trends analysis. During the process we find out how buyers and sellers are feeling about their company’s ability to be successful in the current steel environment (SMU Steel Buyers Sentiment Index) and we probe many other areas of interest to those manufacturing, distributing or servicing the industry.
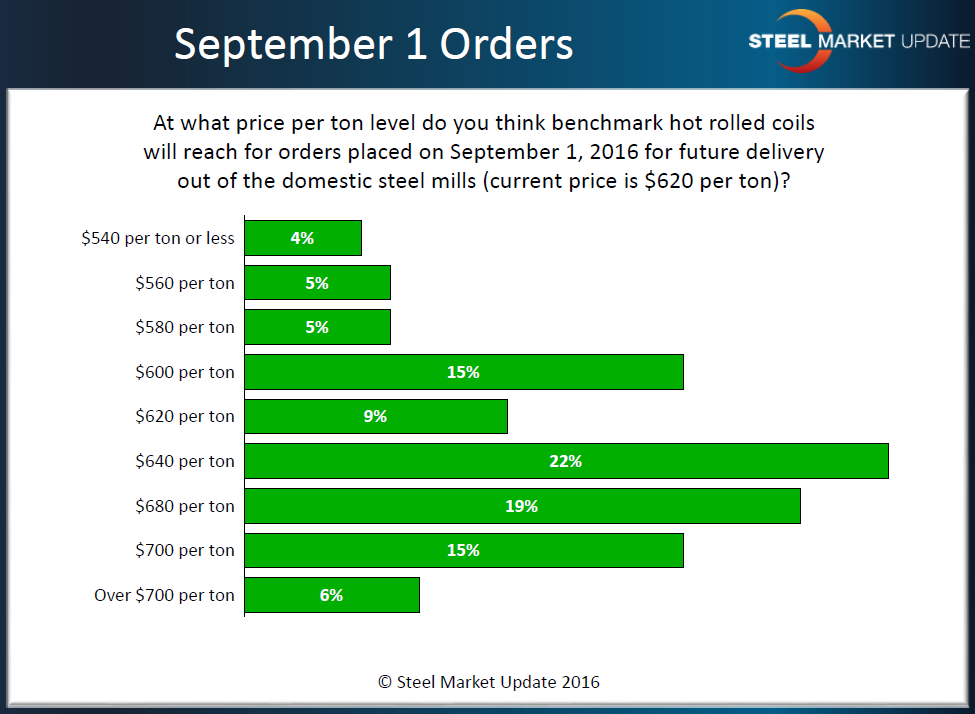
During last week’s analysis we asked our respondents as to what price level did they think benchmark hot rolled coil would reach on new orders placed for future delivery on September 1, 2016?
With our SMU HRC index now at $620 per ton, we found 62 percent of those responding believing prices would go higher from here. The largest grouping ranged from $640 to $700 per ton with 56 percent believing these levels will be reached by September 1st.
Comments made during the survey process:
“By then with Chinese and potentially global steel pricing being weak, the turn should already be started. Companies will find ways to import steel from new avenues.”
“I would expect the rapid rise start to slowdown over the coming months unless something happens to material availability being further restricted by the mills.”
“I would expect the rapid rise start to slowdown over the coming months unless something happens to material availability being further restricted by the mills.”
“I believe the Domestic Steel Mills are raising prices too much too soon. We all wanted higher prices but this is sticker shock. It is like they are making all of us pay for their 2015 losses from imports. Not Fair. Too Much, Too Soon.”


