Prices

June 9, 2016
April Apparent Steel Supply Down 6.3% Over March, Down 0.9% YOY
Written by Brett Linton
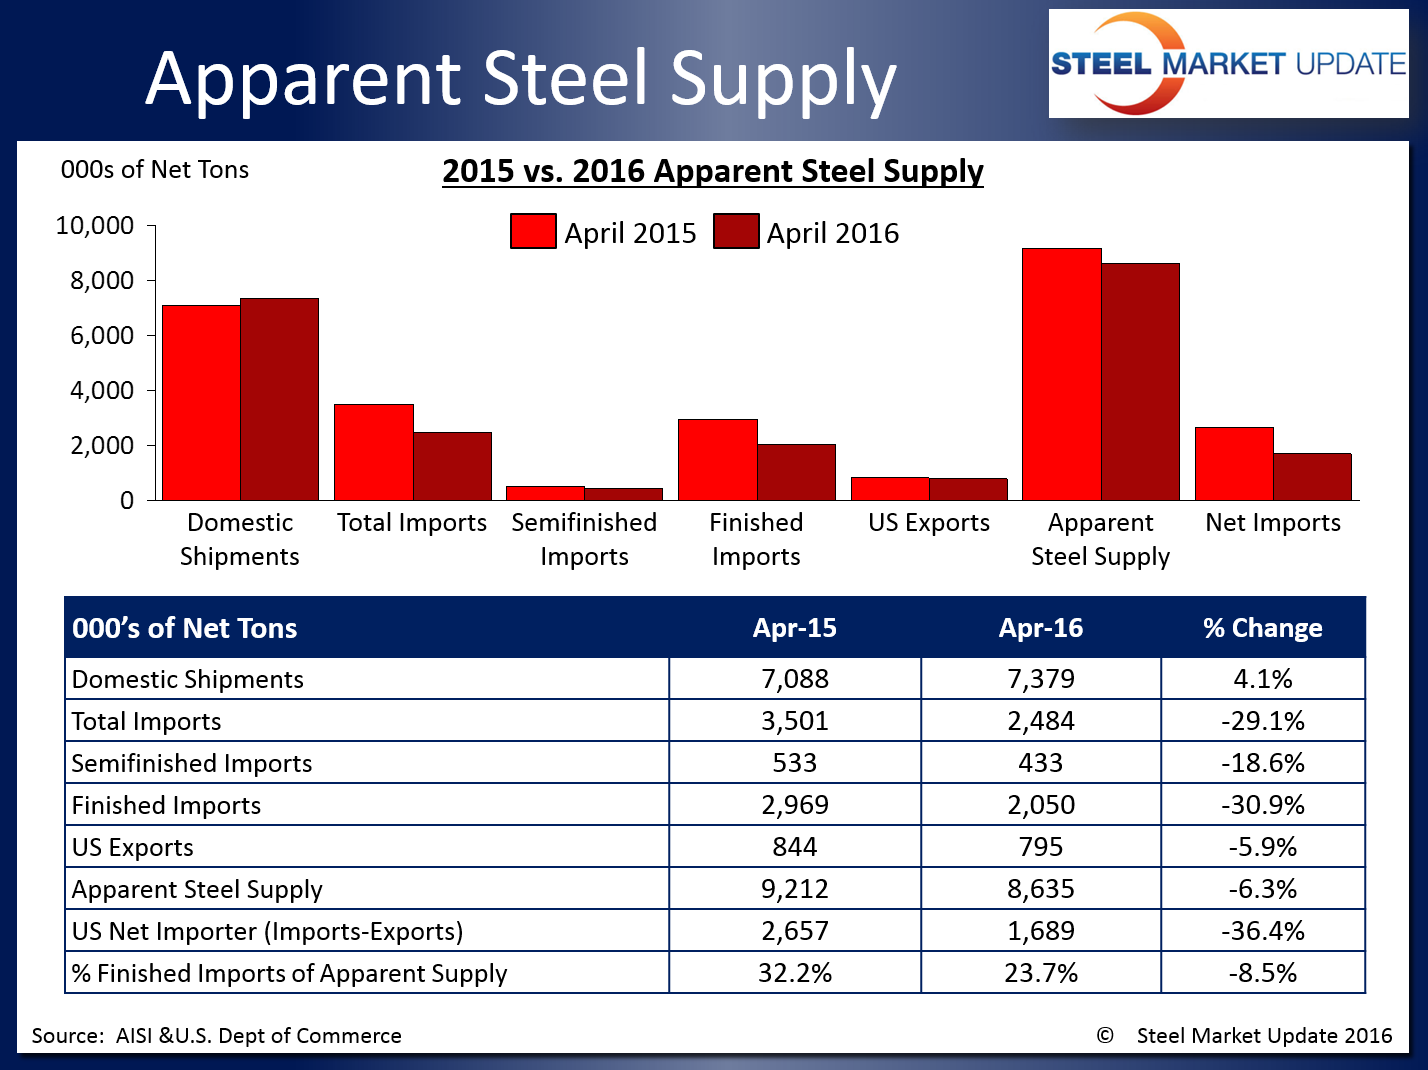
According to the latest data released from the U.S. Department of Commerce and the American Iron and Steel Institute, apparent steel supply for the month of April 2016 was 8,634,917 net tons. Apparent steel supply is calculated by adding domestic steel shipments and finished US steel imports, then subtracting total US steel exports.
April apparent steel supply represents a 577,115 ton or 6.3 percent decrease compared to the same month one year ago when apparent steel supply was 9,212,032 tons. This is primarily attributed to a 918,414 ton or 30.9 percent decline in finished U.S. steel imports, and negated by an increase in domestic shipments of 291,466 tons or 4.1 percent and a decrease in total U.S. steel exports of 49,833 tons or 5.9 percent.
The net trade balance between US steel imports and exports was a surplus of +1,689,044 tons imported in April 2016, 967,923 tons or 36.4 percent less than that of April 2015. Foreign steel imports accounted for 23.7 percent of apparent steel supply, down 8.5 percent over the same month one year ago.
SMU Note: Our Premium Level apparent steel supply analysis goes into much more detail as we provide data on apparent steel supply for flat and long products. In that report we look at the data in a number of ways in order to reach our conclusion which was:
“SMU Comment: The numbers in this report illustrate why it’s necessary to look at different time periods to try to understand the whole picture. We could draw different conclusions based on which time period we chose to describe. Another problem is that it’s now mid-June and the latest data we have for shipments and supply is for April. The AISI puts out weekly data for crude steel production the latest for which was w/e June 4th. This provides the most current data for steel mill activity. Figure 4 [not shown in this article] shows the Y/Y change in weekly crude output on a four week moving average basis. This measure became positive in w/e March 5th and in the latest 15 weeks there has only been one week with negative Y/Y growth. Last month we concluded that based on the above, on the results of our key market indicators analysis, buyer sentiment and the decline in service center excess that March was an inflection point. That conclusion still seems valid and we expect that for at least the next few months we will continue to see improvements in both supply and mill shipments.” We published this analysis to our Premium level members on Wednesday of this week.
Month over month & Year to Date comparisons:
When compared to last month when apparent steel supply was at 8,716,178 tons, April supply decreased by 81,261 tons or 0.9 percent. This is due to a 3.0 percent decline in finished imports and a 2.5 percent increase in total exports. Domestic shipments were completely flat from March to April (up less than 2,000 tons).
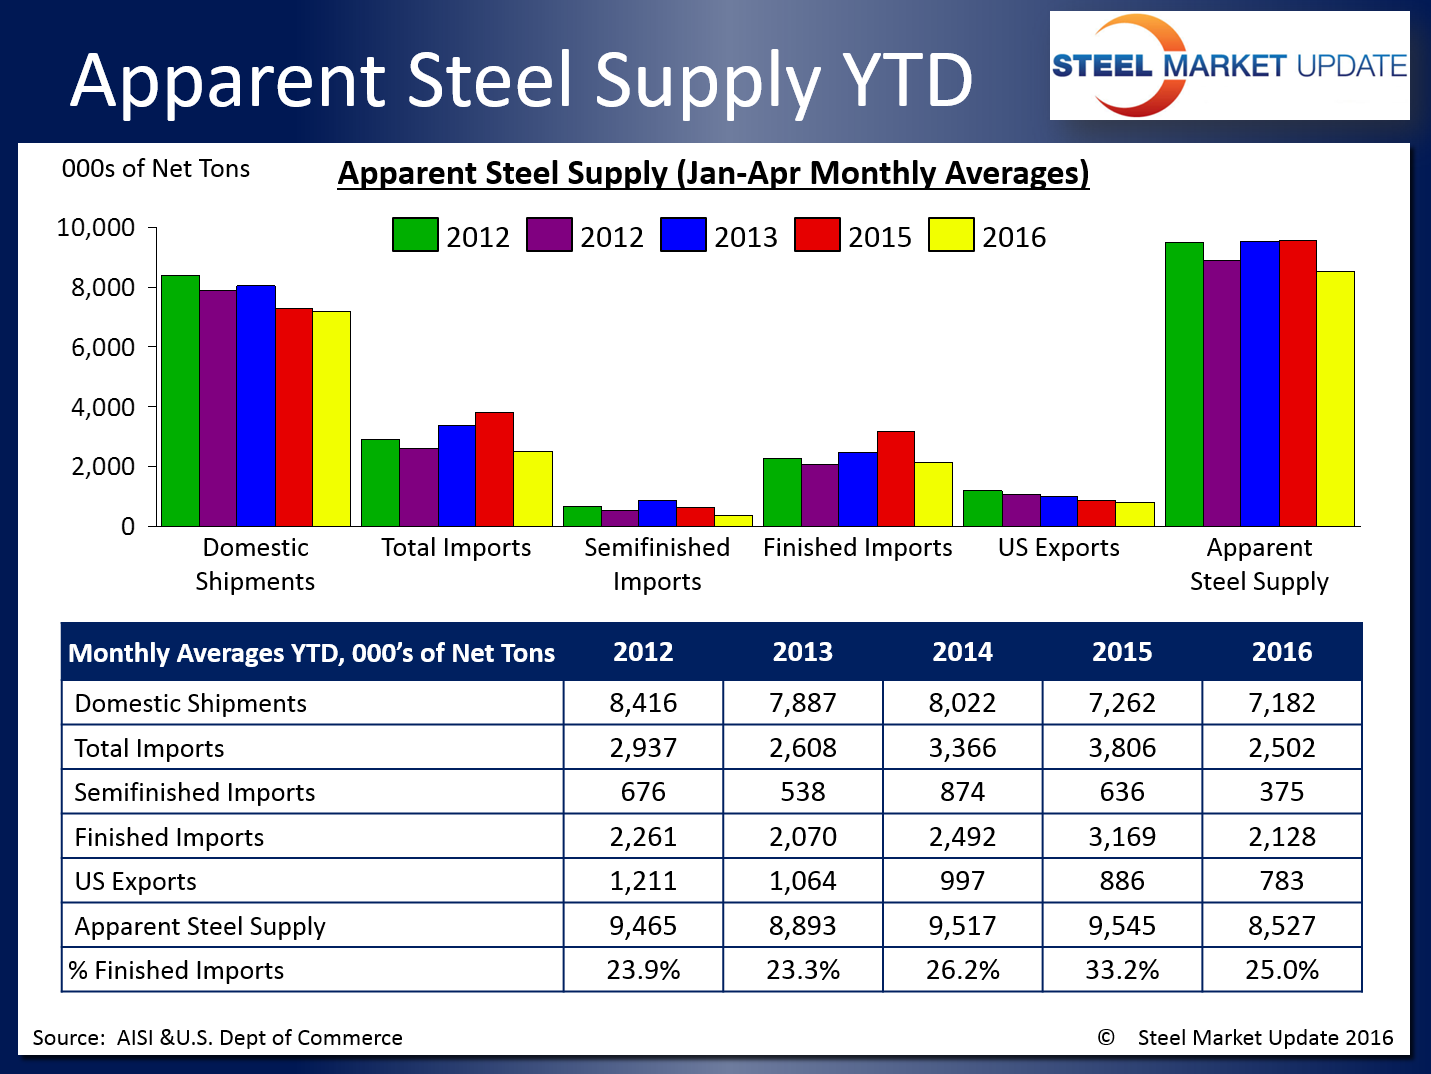
The table below shows year to date totals for each statistic over the last five years. Note that these averages are calculated through the first four months of the year. 2016 figures so far remain lower than most of the previous years for all items listed.
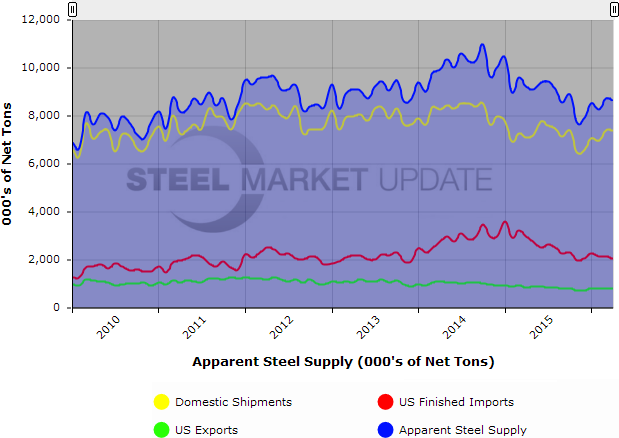
To use the interactive features of the Apparent Steel Supply History graphic below, visit the Apparent Steel Supply page in the Analysis section of the SMU website. If you need any assistance logging in or navigating the website, contact us at info@SteelMarketUpdate.com or 800-432-3475.