

Prices

June 9, 2016
HRC Futures Curve: A Good Prognosticator of Hot Rolled Price Moves?
Written by David Feldstein
The following article on the hot rolled coil (HRC), busheling scrap (BUS), and financial futures markets was written by Dave Feldstein. As Flack Steel’s director of risk management, Dave is an active participant in the hot rolled coil (HRC) futures market and we believe he will provide insightful commentary and trading ideas to our readers. Besides writing Futures articles for Steel Market Update, Dave produces articles that our readers may find interesting under the heading “The Feldstein” on the Flack Steel website www.FlackSteel.com.
Does the HRC Futures Curve Accurately Predict Future Prices?
Sorry, but no.
The HRC futures market curve consists of 24 consecutive months of futures prices that settle financially (i.e. no physical HRC is delivered) based on the average of the CRU HRC Midwest Index for that particular month. Open interest, which is the cumulative amount of tonnage for all of the 24 months at a point in time, has been between 400k – 500k short tons for some time. My best guess is there are roughly 30-40 HRC futures market participants comprised of a handful of service centers, OEMs and financial institutions.
Every day, the Chicago Mercantile Exchange settles the “curve” based on any transactions that took place, a survey from the brokers to indicate where the buyers and sellers are looking to transact and some kind of model for the parts of the curve where two sided interest is missing. The result is either an upward sloping, flat or downward sloping curve.
Currently, the market has a very steep downward slope.

As you can see, Q3 is trading around $575 and Q4 is trading around $540. Is this a reliable indicator that a steep price drop is imminent? No. This is simply where the group of futures market participants discussed above are willing to transact at for a number of reasons.
In fact, for every future there is a buyer and a seller. A future, unlike a stock or bond, is literally created from nothing when a buyer and seller come together and agree on a price in the future to transact at. This is called open interest and the more transactions take place, the more open interest is created. So if the individual selling at $540 is using the curve to forecast that prices will fall by Q4 and the curve is a reliable predictor of future prices, why would anyone want to take the other side of that trade? It is a rather simplistic approach; one that is naïve to think that predicting asset prices is that easy and that the financial markets wouldn’t have squeezed the profits out of this anomaly a long time ago.
Regardless, it remains an area of interest and if you Google something like “the forecasting accuracy of futures curves,” you’ll find a number of academic research and articles written on the topic. For instance:
The Board of Governors of the Federal Reserve System released “Forecasting the Price of Oil,” by Alquist et all in July 2011.
“We conclude that there is no compelling evidence that, over this sample period, monthly oil futures prices were more accurate predictors of the nominal price of oil than simple no- change forecasts. Put differently, a forecaster using the most recent spot price would have done just as well in forecasting the nominal price of oil.”
The Board of Governors of the Federal Reserve System followed up the previous paper with “Evaluating the Forecasting Performance of Commodity Futures Prices,” by Trevor Reeve and Robert Vigfusson in August 2011.
“The key results of our analysis are that futures prices have generally outperformed a random walk forecast, but not by a large margin.”
“Commodity futures prices are frequently criticized as being uninformative for forecasting purposes because (1) they seem to do no better than a random walk” (Alquist et al., 2011)
The International Monetary Fund released “Do Commodity Futures Help Forecast Spot Prices,” by Reichsfeld and Roache in November 2011.
“We find that the forecasting performance of futures does not depend on the slope of the futures curve, in contrast to the predictions of well-known models of commodity markets. We also find futures’ forecasting performance to be invariant to whether prices are in an upswing or downswing”
If the findings of these research professionals don’t convince you, then take a look at the performance of the HRC futures curve starting in 2013.
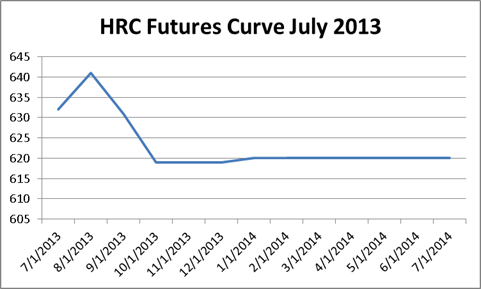
Here is the HRC futures curve on July 1st, 2013 with a downward slope.
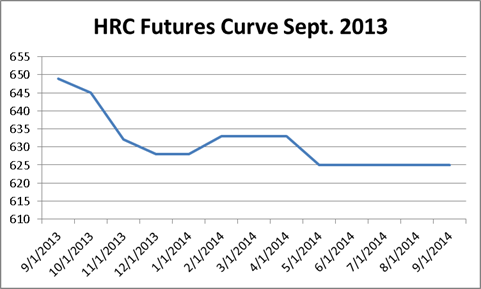
Here is the HRC futures curve on September 1st, 2013 with an even steeper downward slope. The spread between the front month and the 7th month increased to $22 from $12.
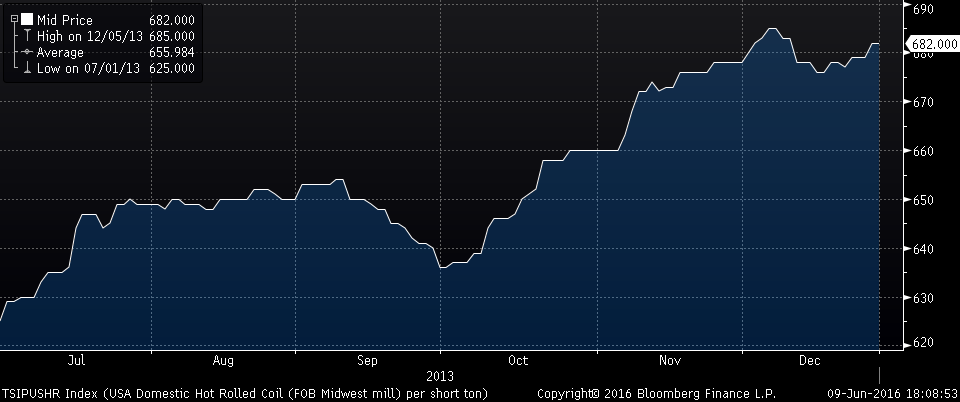
Did it accurately predict prices would fall? No! The TSI Daily Midwest HRC Index went from $625/t on July 1st to $682/st by December 31st.
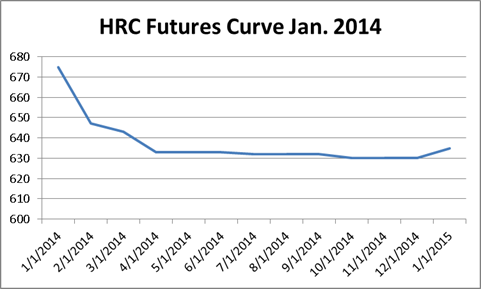
Here is the HRC futures curve as of January 1st, 2014 with an ever steeper curve yet. The difference between the 1st and 7th month futures had increased to $43/st.
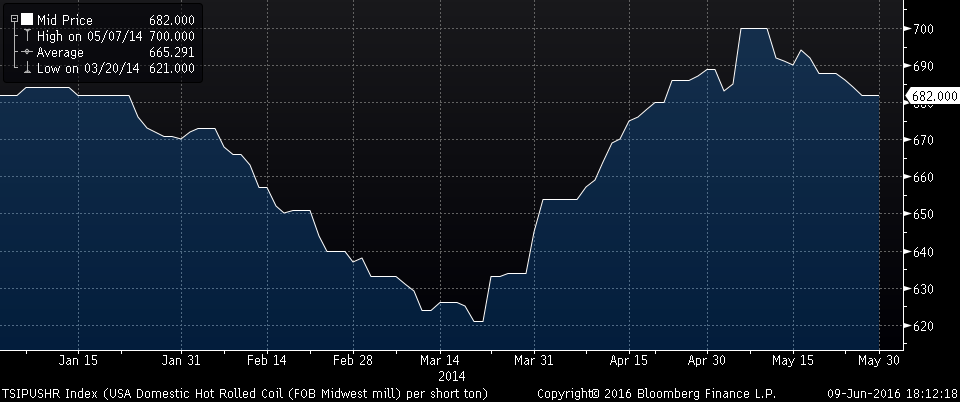
The TSI Daily Midwest HRC Index did fall from $682 to $620/st by mid-March 2014, before tearing back up to $700/st by early May. Apparently the curve failed to prognosticate the many supply disruptions and ore shortage that occurred in early 2014.
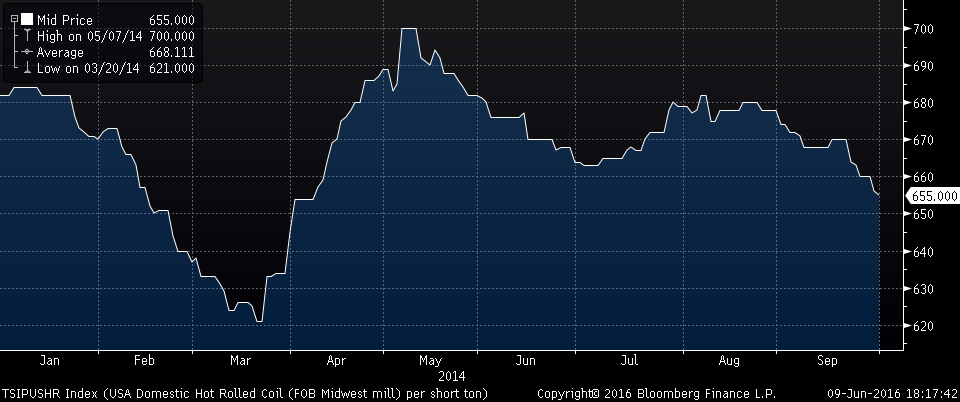
In fact, the winning HRC futures trade in 2014 was to keep buying future months on the curve as prices remained elevated above $650 through September. Looking back at the futures curve on January 1st, 2014 you could have purchased Q2 and Q3 for $630 while the indexes pulled prices $20 – $70/st above that.
Let’s fast forward to early 2015. In January, the curve began shifting from downward sloping to flat and then to upward sloping.
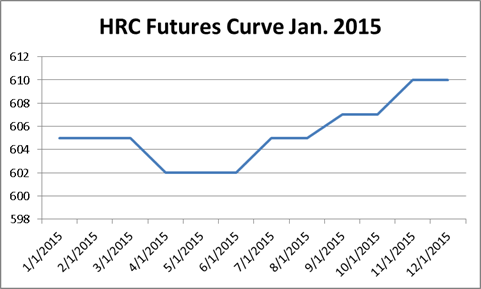
Here in January 2015, the slope is pretty flat, but upward sloping. Back to our question of if the curve provides any reliable information about where prices are heading. So if a downward sloping curve is telling you prices will be lower in the future, then is an upward sloping curve telling you prices will be higher in the future?
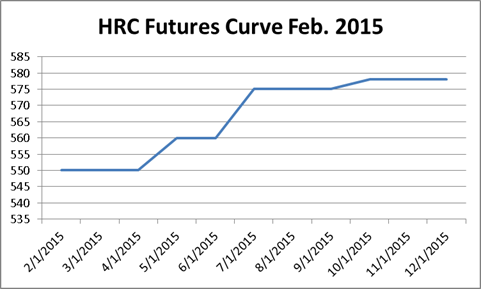
As HRC prices begin their collapse, the curve is becomes increasingly upward sloping. Would it pay to buy forward?
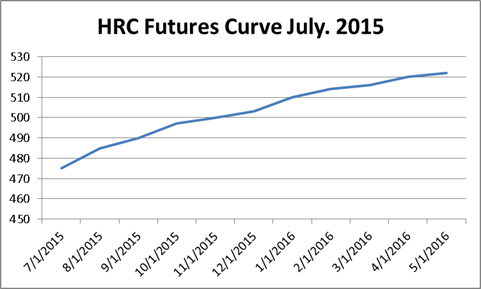
Come July, the curve has steeped even more. Would it have been a good move to buy forward based on what the curve is telling you? You could have bought Q4 and Q1 for around $500/st.
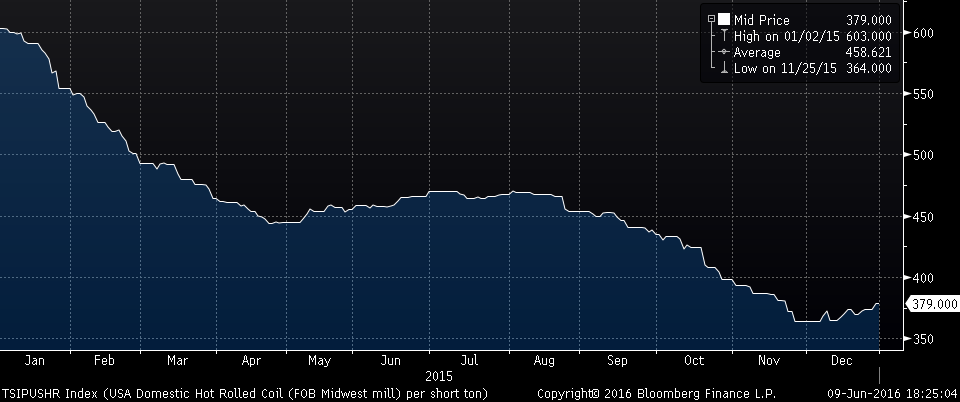
As we all know, that would have resulted in massive losses.
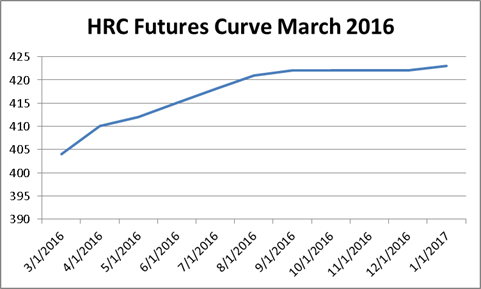
Here is the curve as of March 1st, 2016 with a slight upward slope.
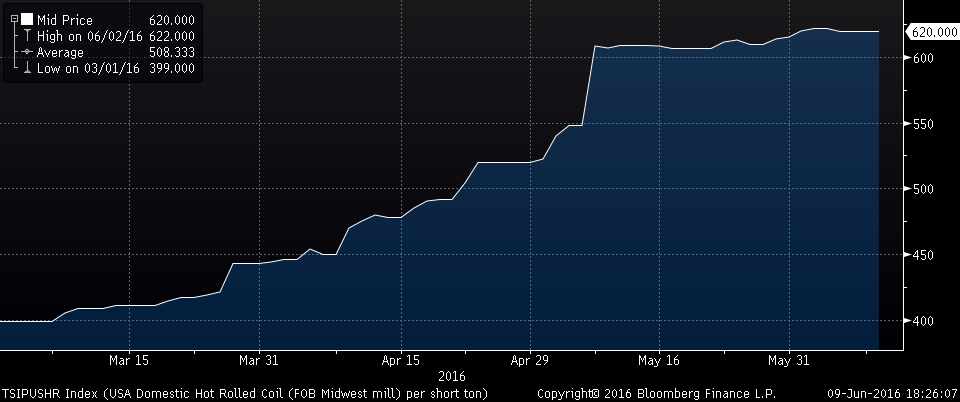
Was it telling you the market was on the cusp of a 50% rally?
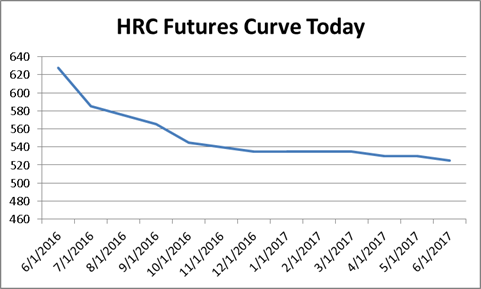
And here we are with the curve as of today. Is it telling you that prices are about to collapse? To be clear, I am not saying that prices will or won’t end up at or below $540/st by Q4 2016, I am just simply making the point that the shape of the curve nor where the futures prices are at at a given point in time can provide any reliable guidance for the future direction of prices.
I hope the research and empirical evidence presented above has shown you this. However, the curve can be extremely useful. That is to transfer price risk out of your business and into the market. So if buying tons in Q4 at $540/st is something that works for your business, then that’s how to maximize the forward curve. Or if you plan to bring in imported tons at a very low price and want to hedge the price risk by selling Q4 at $540, then that might be a good strategy too.


