

Market Data

June 12, 2016
Shipments and Supply of Sheet Products through April 2016
Written by Peter Wright
SMU received a couple of inquiries about sheet shipments and one of our Premium customers had a specific question about the data presented in one of our Premium supplemental issues last week. We thought that we should share the data and then present at the end the question and our response for all of our readers. If you have any questions about the content or would like more information about becoming a Premium level member please contact our offices at: 800-432-3475.
This report summarizes total steel supply from 2003 through April 2016 and year on year changes. It then compares domestic mill shipments and total supply to the market. It quantifies market direction by product and enables a side by side comparison of the degree to which imports have absorbed demand. Sources are the American Iron and Steel Institute and the Department of Commerce with analysis by SMU.
![]()
Table 1 shows both apparent supply and mill shipments of sheet products (shipments includes exports) side by side as a three month average through April, for both 2015 and 2016.
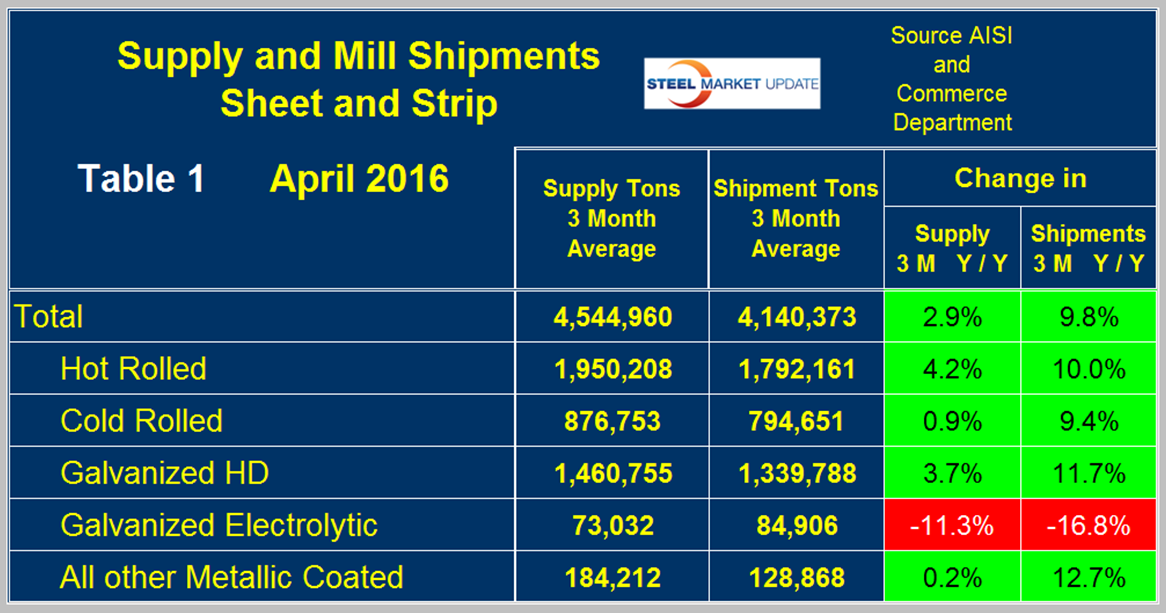
Apparent supply is a proxy for market demand. Comparing these two time periods, total supply to the market was up by 2.9 percent and shipments were up by 9.8 percent. The fact that shipments were up by more than supply means that imports put less pressure on the market than they did in most of 2015. Table 1 breaks down the total into product detail and it can be seen that this was true for all products except electro-galvanized which is a special case because EG has a trade surplus. The other sheet products all have a net trade deficit.
A review of supply and shipments separately for individual sheet products is given below.
Apparent Supply
Apparent Supply is defined as domestic mill shipments to domestic locations plus imports. In three months through April 2016 the average monthly supply of sheet and strip was 4.545 million tons, up by 2.9 percent year over year as mentioned above but up by 10.6 percent comparing February through April with the previous three months. The short term improvement (3 months) compared to the long term improvement (12 months) means that momentum is very positive. Table 2 shows the change in supply by product on this basis through April. Momentum was positive for all products including electro-galvanized where the decline slowed.
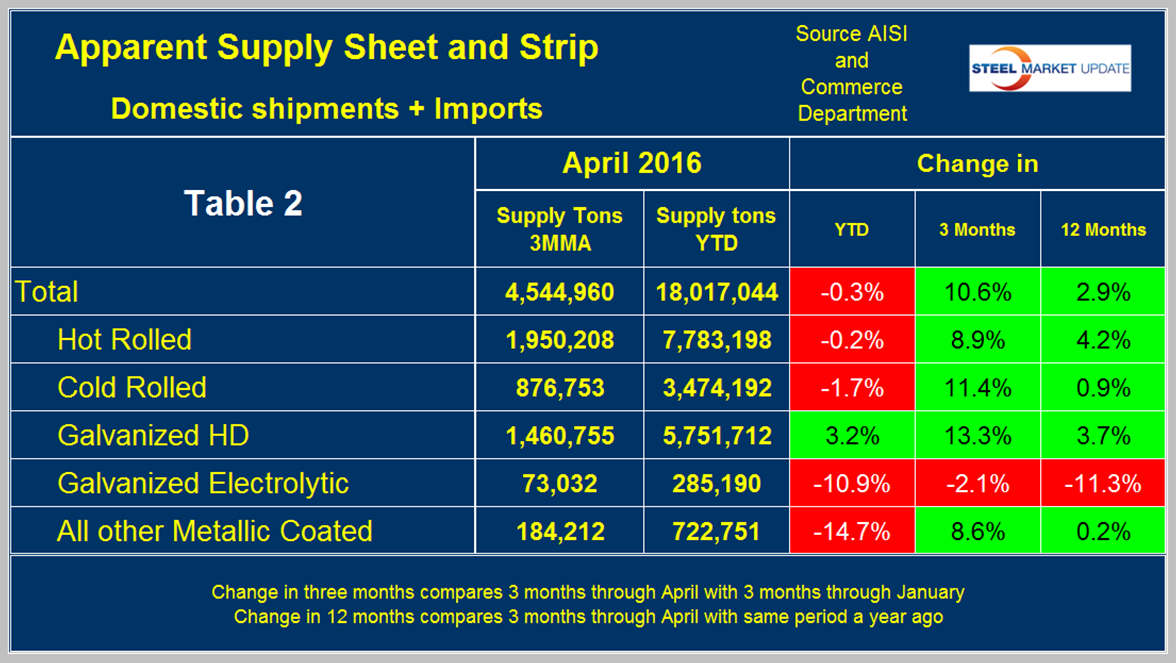
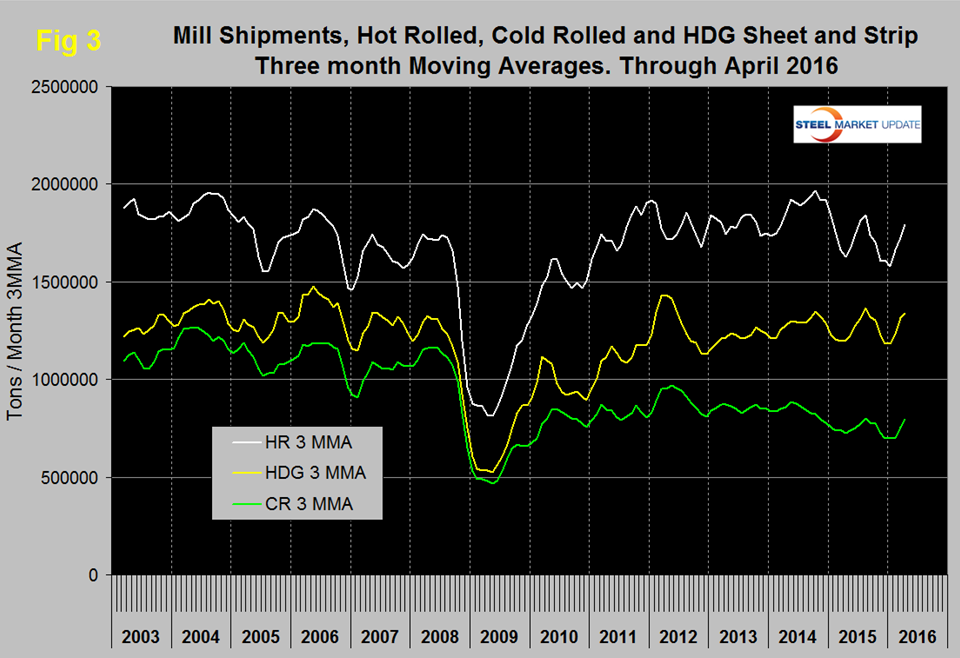
Figure 1 shows the long term supply picture for the three major sheet and strip products, HR, CR and HDG since January 2003 as three month moving averages.
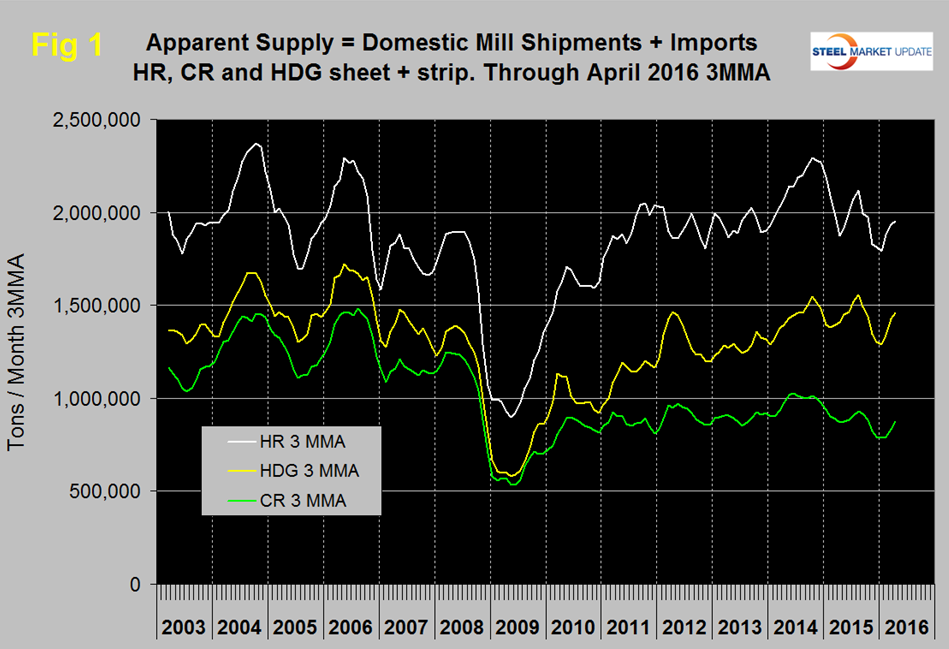
Figure 2 shows import market share of sheet products and includes long products for comparison.
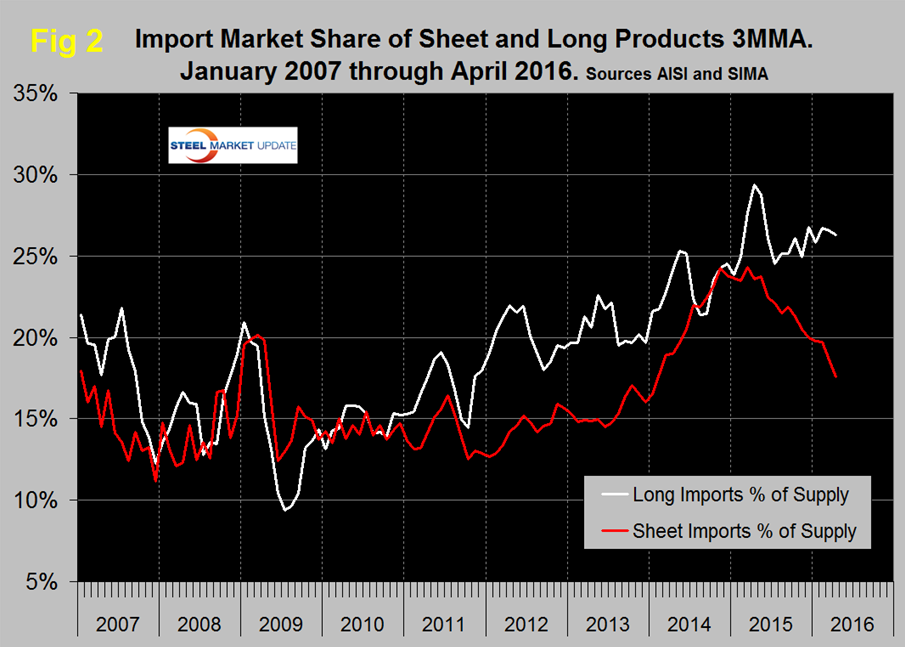
Based on a 3MMA the import market share of sheet products has declined more or less continuously since February 2015 when it was 24.3 percent to 17.6 percent in April 2016. Long product import market share peaked at 29.4 in April last year, declined to 24.5 percent in July then increased erratically to 26.3 percent in this latest data.
Mill Shipments
Table 3 shows that total shipments of sheet and strip products including hot rolled, cold rolled and all coated products were up by 9.8 percent in 3 months through April year over year and up by 12.7 percent comparing three months through April with three months through January.
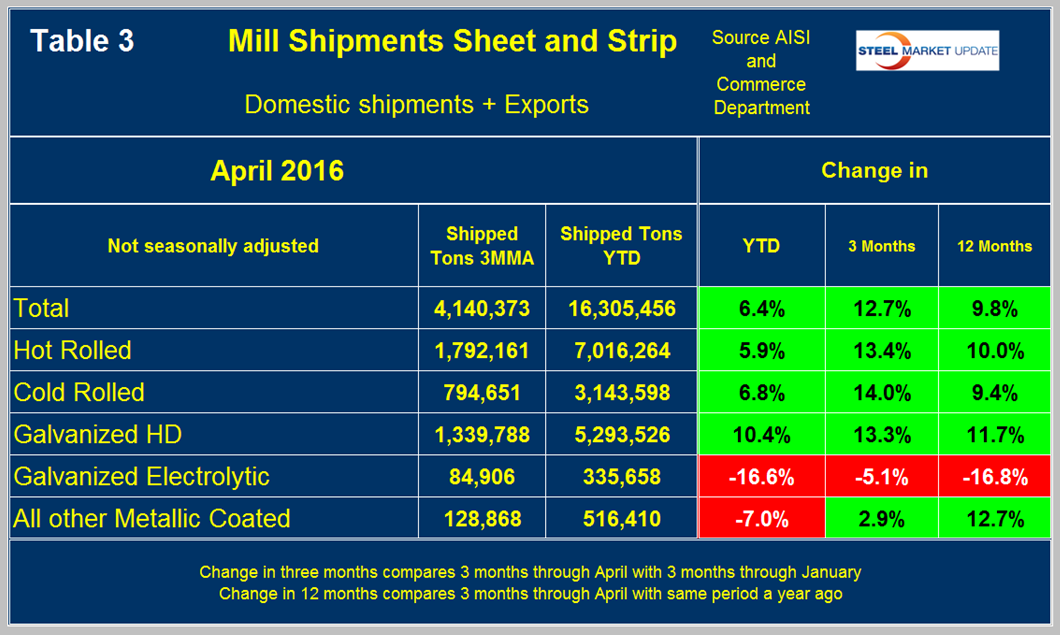
All products, except other metallic coated (mainly Galvalume), had positive momentum meaning that the improvement is accelerating. Electro-galvanized had positive momentum because the rate of contraction declined. Figure 3 puts the results for the three main products into the long term context since January 2003. All three have had positive growth this year.
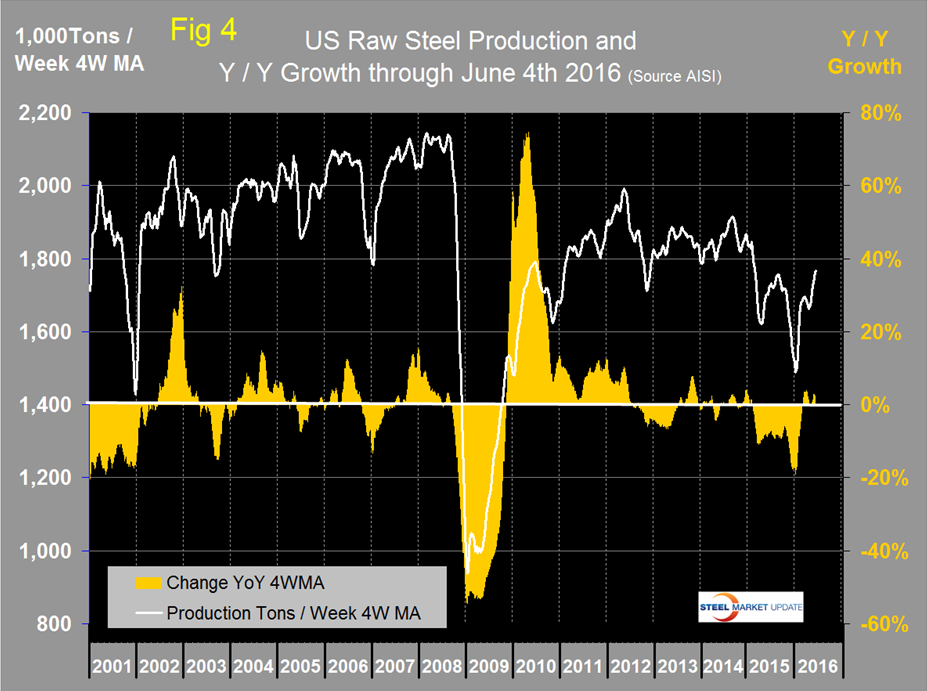
SMU Comment: The numbers in this report illustrate why it’s necessary to look at different time periods to try to understand the whole picture. We could draw different conclusions based on which time period we chose to describe. Another problem is that it’s now mid-June and the latest data we have for shipments and supply is for April. The AISI puts out weekly data for crude steel production the latest for which was w/e June 4th. This provides the most current data for steel mill activity. Figure 4 shows the Y/Y change in weekly crude output on a four week moving average basis. This measure became positive in w/e March 5th and in the latest 15 weeks there has only been one week with negative Y/Y growth. Last month we concluded that based on the above, on the results of our key market indicators analysis, buyer sentiment and the decline in service center excess that March was an inflection point. That conclusion still seems valid and we expect that for at least the next few months we will continue to see improvements in both supply and mill shipments.
The question we received from one of our readers was, “John, I’m lifting one of the paragraphs from last night’s article on supply and wondering if the assumption is that you expect inventory to grow over the coming months? Or, is the expectation simply a growth in supply, irrespective of demand, and thus not a predictor of inventory direction?”
Regarding inventory, I’m thinking that we see maybe some slight rises in the summer months due to seasonality, but that we don’t see a sizable increase in fall, and in fact could see levels stay in the low 2’s until winter…
“SMU Comment: The numbers in this report illustrate why it’s necessary to look at different time periods to try to understand the whole picture. We could draw different conclusions based on which time period we chose to describe. Another problem is that it’s now mid-June and the latest data we have for shipments and supply is for April. The AISI puts out weekly data for crude steel production the latest for which was w/e June 4th. This provides the most current data for steel mill activity. Figure 4 [not shown in this article] shows the Y/Y change in weekly crude output on a four week moving average basis. This measure became positive in w/e March 5th and in the latest 15 weeks there has only been one week with negative Y/Y growth. Last month we concluded that based on the above, on the results of our key market indicators analysis, buyer sentiment and the decline in service center excess that March was an inflection point. That conclusion still seems valid and we expect that for at least the next few months we will continue to see improvements in both supply and mill shipments.” We published this analysis to our Premium level members on Wednesday of this week.”
Peter Wright responded to our readers question with the following:
“My take on these numbers is that we have insight into apparent supply and the relationship between mill shipments and imports as sources of that supply. Apparent supply is a proxy for demand but it really isn’t because we don’t have a measure of total inventory at the OEMs and service centers. So I think the answer to your question about where inventories are headed is that the data presented does not point one way or the other. I think John’s measure of excess at the service center level is probably the best guide for what you are looking for.”
The guide that Peter is referring to is our Service Center Inventories Apparent Excess/Deficit model which is another one of our Premium level products. With the MSCI slated to release their service center shipment and inventories data later this week we will produce a new Apparent Excess/Deficit report by the end of the week.


