

Market Data

June 19, 2016
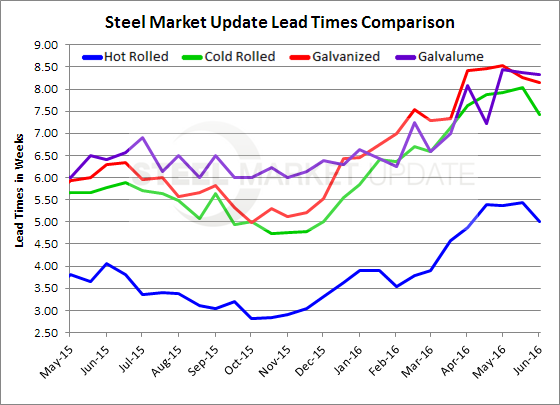
Steel Mill Lead Times: Past Peak?
Written by John Packard
Steel mill lead times, the amount of time it takes to get steel produced from the time a flat rolled steel order is placed, have apparently peaked and we are beginning to see signs of a slight pull back in all but coated products. Having said that, lead times still continue to be highly extended compared to one year ago.
Hot rolled lead times, which one year ago averaged 4 weeks (4.06) are now averaging 5.00 weeks according to the most recent results produced by our flat rolled steel market trends analysis this past week. The 5 weeks is two weeks longer than what we were reporting back in October and November 2015.
Cold rolled lead times average 7.5 weeks this past week. This is down from 8.0 weeks reported at the beginning of June. However, one year ago cold rolled lead times were averaging less than 6 weeks (5.78). At the low point back in early 4th Quarter 2015, CR lead times were under 5 weeks.
The lead times on galvanized steel continue to be extended averaging slightly more than 8 weeks (8.15) well above the 6.29 weeks reported on year ago. At the low point during the 4th Quarter of 2015 GI lead times were at, or just above, 5 weeks.
Galvalume lead times continue to be above 8 weeks (8.33) where they have been since the middle of May 2016. One year ago AZ lead times were just shy 6.5 weeks (6.40) and at the low point in were averaging 6.0 weeks.
Lead times are a good measure of the strength of the domestic steel mill order books. The longer the lead time the stronger the book of business at the mills. The stronger the book the less negotiating the steel mills have to do to get customers to place orders.
A side note: The data for both lead times and negotiations comes from only service center and manufacturer respondents. We do not include commentary from the steel mills, trading companies, or toll processors in this particular group of questions.
To see an interactive history of our Steel Mill Negotiations data, visit our website here.


