Market Data

June 26, 2016
May Durable Goods Orders Weaker than Expected
Written by Sandy Williams
New orders for manufactured durable goods fell 2.2 percent in May to $230.7 billion after a revised gain of 3.3 percent in April, according to the U.S. Commerce Department.
A Wall Street Journal survey of economists forecast a 0.4 percent drop while Bloomberg predicted a decline of 0.5 percent. May’s decline was broad-based across almost every category with transportation equipment orders leading with a tumble of 5.6 percent.
Core capital goods orders excluding aircraft, a sign of business investment, decreased 0.7 percent. Core goods have increased only six times in the last 17 months.
Bloomberg wrote, “The decline in capital goods is certain to pull back second-quarter GDP estimates which, in the 2 percent range, aren’t that strong to begin with. The dollar’s decline this year has not done much to lift exports or the factory sector which going into Brexit, and the ensuing spike in the dollar, was simply flat.”
Barclays economist Jesse Hurwitz said in a note to clients that Friday’s report showed “broad-based and persistent softness across the U.S. manufacturing sector.”
Text from the May 2016 Advance Report on Durable Goods:
New Orders. New orders for manufactured durable goods in May decreased $5.3 billion or 2.2 percent to $230.7 billion, the U.S. Census Bureau announced today. This decrease, down following two consecutive monthly increases, followed a 3.3 percent April increase. Excluding transportation, new orders decreased 0.3 percent. Excluding defense, new orders decreased 0.9 percent. Transportation equipment, also down following two consecutive monthly increases, led the decrease, $4.8 billion or 5.6 percent to $81.9 billion.
Shipments. Shipments of manufactured durable goods in May, down three of the last four months, decreased $0.5 billion or 0.2 percent to $231.7 billion. This followed a 0.4 percent April increase. Transportation equipment, also down three of the last four months, led the decrease, $0.4 billion or 0.5 percent to $80.0 billion.
Unfilled Orders. Unfilled orders for manufactured durable goods in May, up four of the last five months, increased $2.0 billion or 0.2 percent to $1,139.4 billion. This followed a 0.6 percent April increase. Transportation equipment, up three consecutive months, led the increase, $1.9 billion or 0.2 percent to $785.2 billion.
Inventories. Inventories of manufactured durable goods in May, down ten of the last eleven months, decreased $1.1 billion or 0.3 percent to $382.5 billion. This followed a 0.4 percent April decrease. Machinery, down nine of the last ten months, led the decrease, $0.5 billion or 0.8 percent to $65.4 billion.
Capital Goods. Nondefense new orders for capital goods in May decreased $0.6 billion or 0.8 percent to $73.8 billion. Shipments increased $0.8 billion or 1.2 percent to $72.8 billion. Unfilled orders increased $1.1 billion or 0.2 percent to $708.6 billion. Inventories decreased $0.6 billion or 0.3 percent to $171.3 billion. Defense new orders for capital goods in May decreased $3.7 billion or 28.0 percent to $9.5 billion. Shipments increased $0.2 billion or 2.1 percent to $9.8 billion. Unfilled orders decreased $0.3 billion or 0.2 percent to $140.3 billion. Inventories decreased $0.1 billion or 0.3 percent to $20.8 billion.
Revised April Data. Revised seasonally adjusted April figures for all manufacturing industries were: new orders, $460.1 billion (revised from $460.5 billion); shipments, $456.4 billion (revised from $456.8 billion); unfilled orders, $1,137.4 billion (revised from $1,137.3 billion); and total inventories, $619.8 billion (revised from $620.8 billion).
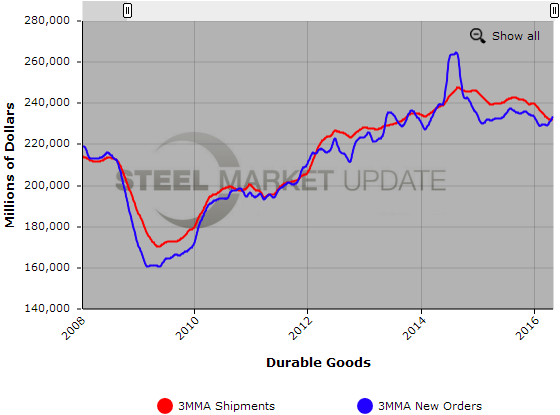
Below is a graph showing the history of Durable Goods. You will need to view the graph on our website to use it’s interactive features, you can do so by clicking here. If you need assistance with either logging in or navigating the website, please contact our office at 800-432-3475 or info@SteelMarketUpdate.com.