

Market Data

July 7, 2016
Lead Times Drop - Still Longer than One Year Ago
Written by John Packard
On Tuesday of this week Steel Market Update began canvassing the flat rolled steel industry through the use of our online survey which we use twice per month. We invited slightly more than 550 people to participate as we try to analyze market trends.
One of the key areas of inquiry is that of lead times, the amount of time it takes to get steel produced from an order placed this week with the domestic steel mills. The lead time, which is also called the “promise date,” is provided by the domestic mills to their customers.
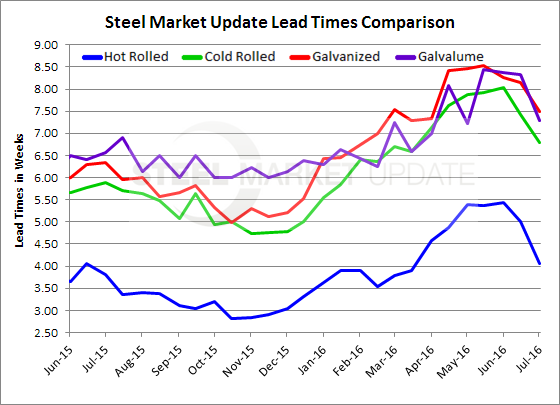
Our survey asks manufacturing and steel service centers to provide their opinions as to what they are seeing for lead times on hot rolled, cold rolled, galvanized and Galvalume steels. The lead times are referenced in the number of weeks and our results are an average of the combined responses received.
Hot rolled lead times average 4 weeks (4.07) which is one week shorter than what we measured just two weeks ago and one and a half week less than what we saw at the beginning of May. One year ago lead times were similar to this week’s result (3.82 weeks). This portrays the weakness in the product as all of the other items (CR, GI, AZ) have longer lead times than one year ago.
Cold rolled lead times were just under 7 weeks (6.79) and are about three-quarters of a week shorter than one month ago but almost one week longer than one year ago.
Galvanized lead times averaged seven and a half weeks, down from eight and a quarter weeks one month ago. One year ago GI lead times were at 6.33 weeks.
Galvalume lead times averaged 7.29 weeks this week. This is down from 8.38 weeks at the beginning in June. One year ago AZ lead times were 6.56 weeks.
Lead times are a good measure of the strength of the domestic steel mill order books. The longer the lead time the stronger the book of business at the mills. The stronger the book the less negotiating the steel mills have to do to get customers to place orders.
A side note: The data for both lead times and negotiations comes from only service center and manufacturer respondents. We do not include commentary from the steel mills, trading companies, or toll processors in this particular group of questions.
To see an interactive history of our Steel Mill Negotiations data, visit our website here.


