

Market Data

July 26, 2016
China’s Economic Statistics and Steel Production through Q2 2016
Written by Peter Wright
Figure 1 shows published data for the growth of GDP, industrial production and consumer prices through the second quarter of 2016. The GDP and industrial production portions of this graph are three month moving averages. The growth of GDP was 6.7 percent in the second quarter, which was unchanged from the first quarter, down from 6.8 percent in the fourth quarter of 2015, and the slowest pace since the global financial crisis. The growth rate of GDP has declined steadily since it peaked at 11.9 percent in Q1 2010.
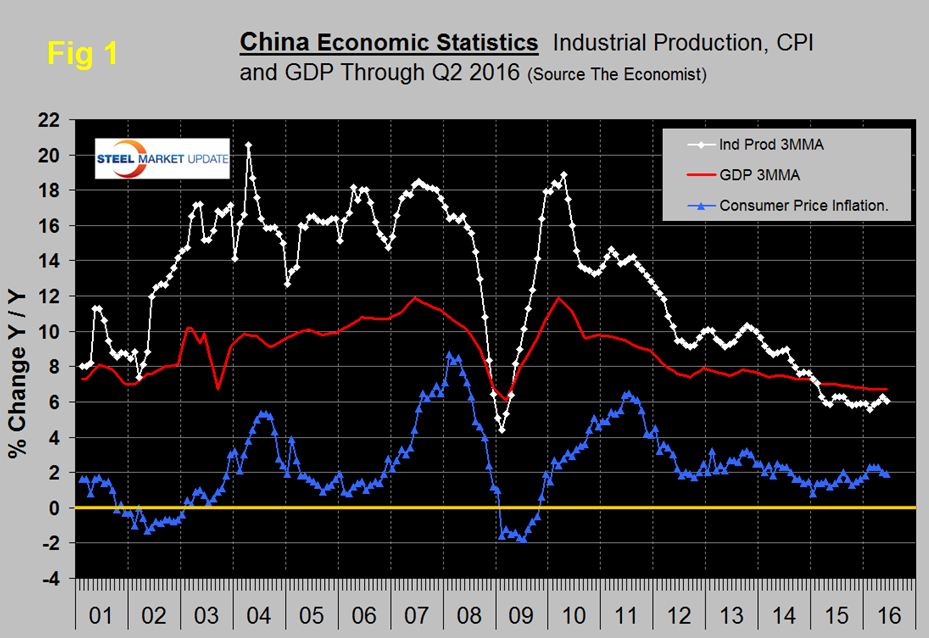
Economy.com summarized as follows: “Despite concurrently released data showing China’s economy expanded at a stronger than expected pace in the June quarter, the outlook remains one of slowing growth. Authorities continue to support a rebalancing of the economy from investment-driven growth to a more sustainable, albeit slower, consumption-led growth path. This was reflected in improvements in retail spending and industrial production, despite the disappointing investment figures. Overcapacity in heavy industry will remain the biggest drag on the investment outlook, while government projects will provide some relief.”
Last week the IMF had this to say about global growth in the first quarter of 2016. “Turning to indicators of real activity, output growth in the first quarter of 2016 was somewhat better than expected in emerging market and developing economies and roughly in line with projections for advanced economies, with better-than-expected euro area growth counterbalancing weaker U.S. growth. Productivity growth in most advanced economies remained sluggish, and inflation was below target owing to slack and the effect of past declines in commodity prices. Indicators of real activity were somewhat stronger than expected in China, reflecting policy stimulus, as well as in Brazil and Russia, with some tentative signs of moderation in Brazil’s deep downturn and stabilization in Russia following the rebound in oil prices. While global industrial activity and trade have been lackluster amid China’s rebalancing and generally weak investment in commodity exporters, recent months have seen some pick-up due to stronger infrastructure investment in China and higher oil prices.”
Consumer price inflation averaged 1.44 percent in 2015 and so far this year has averaged 2.1 percent.
Figure 2 shows the growth of fixed asset investment y/y.
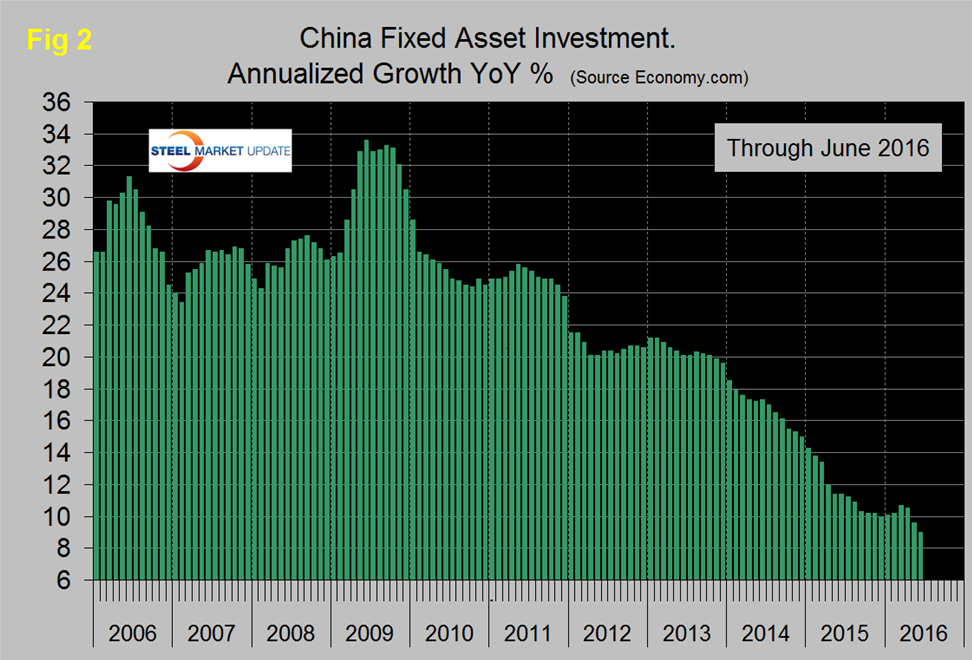
The growth slowdown experienced in 2013 accelerated through all of 2014 through August of 2015. Then the rate of growth slowed, picked up slightly in March and April this year before resuming a slower rate in May and June. In June FAI grew at 9.0 percent y/y which means it is still doubling every 96 months. The lower growth rate is being propped up by public investment as private investment dwindles. Overcapacity in heavy industry is dragging on investment growth, with mining-related investment falling steadily. We understand that this data includes real-estate purchases so is not a direct reflection of constructional steel demand. We are assuming that the steel consumption portion of this investment follows the overall trend and that the contraction in FAI is in accordance with the stated objective to rebalance the economy in favor of consumer consumption. Weaker investment in fixed assets is contributing to slower demand across a number of industries including steel and is pressuring corporate profits.
In this update we decided to include China’s growth in steel production for the first time and will continue to do so in the future. We discussed this briefly in our report last week on global steel production.
Figure 3 shows the 3MMA of China’s crude steel production since March 2005.
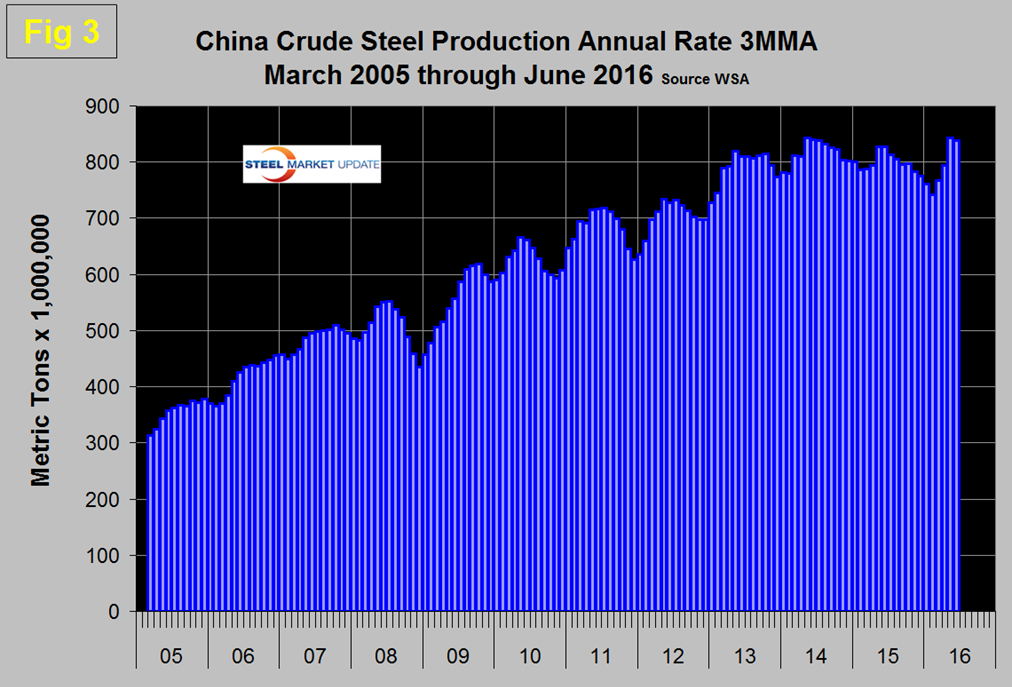
From June 2015 through February this year there was a continuous decline, part of which was seasonal. Then production picked back up and in May and June there was positive year/year growth. Not something that any executive in the rest of the world steel industries wanted to see! Another way of looking at the change in growth is shown in Figure 4. The May and June result follows 13 consecutive months of y/y contraction and zero growth in April.
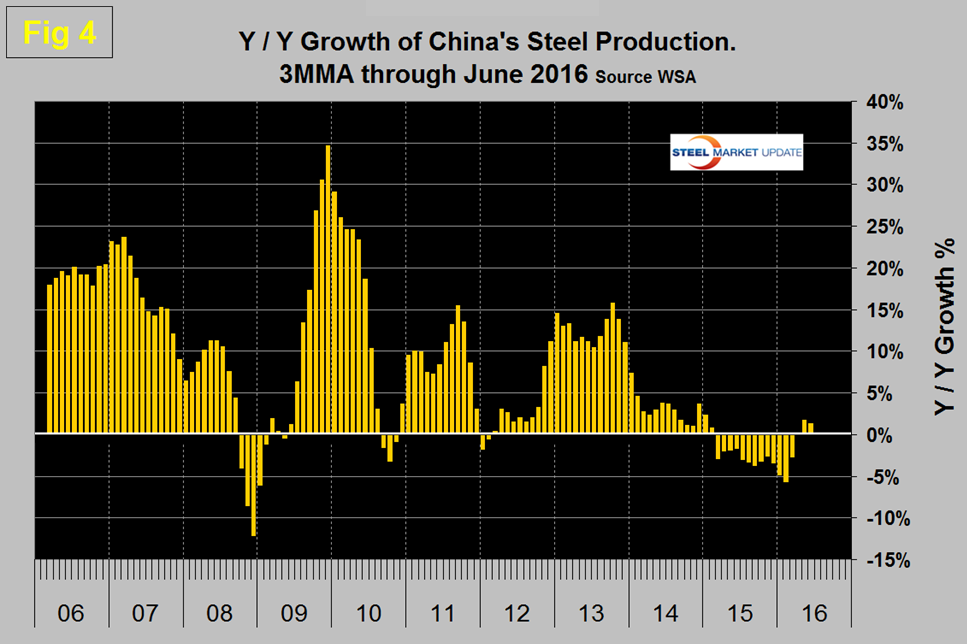
SMU Comment: We had this to say in our update on global steel production last week and will repeat it here: “China’s assistant commerce minister stated in April that China has cut 90M metric tons of capacity and had plans to reduce it by another 100M-150M. This is a start but reducing capacity is not the same thing as reducing production and there is no sign that the reported capacity reduction (if it is for real) is having any effect on output. China’s June production was the fifth highest on record at 69,470,000 tonnes. Their all-time high was 71,161,000 tonnes in June 2014. To put this into perspective with the rest of the world, on a 3MMA basis year over year through June, China had positive growth of 1.3 percent as the rest of the world contracted by 1.7 percent.” We estimate that global steel overcapacity is now about 460 million tonnes per year and of that a high proportion is in China who is now pushing more than the total of US steel production onto the world market.


