

Market Data

December 27, 2016
Steel Mill Lead Times Extended, HRC Showing Signs of Life
Written by John Packard
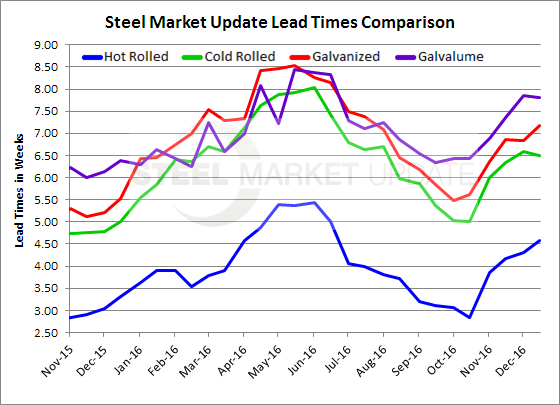
Based on the results of the Steel Market Update flat rolled steel market trends analysis performed prior to the Holiday weekend steel mill lead times continue to be extended. The respondents to our survey reported on the amount of time it takes to get hot rolled, cold rolled, galvanized and Galvalume produced from the time a new order is placed. SMU then takes the data and compiles an “average” lead time on each product. Our lead time averages are not to be construed as the actual lead time a specific mill may be quoting to their customers.
Our respondents reported hot rolled lead times as averaging 4.59 weeks or just slightly longer than the 4.31 weeks reported at the beginning of December and much longer than the just under three weeks we reported in the middle of October (2.84 weeks). One year ago hot rolled lead times were averaging 3.32 weeks.
Cold rolled lead times remained at 6.5 weeks where they have been for the past six weeks (6.35, 6.58 and now 6.5). In the middle of October cold rolled lead times averaged 5.0 weeks which is also what we reported one year ago as well.
Galvanized lead times continued to move out now averaging just over 7 weeks (7.17 weeks). For the previous month we were reporting the average as being just under 7 weeks (6.85 and 6.84 weeks). During the middle of October of this year GI lead times were running around 5.5 weeks. This is also what we saw one year ago (5.52 weeks).
Galvalume lead times are averaging just under 8 weeks according to our survey respondents (7.80 weeks). This is unchanged from the beginning of December (7.85 weeks) but still much longer than the 6.43 weeks we reported during the middle of October. One year ago AZ lead times were 6.38 weeks.
The lengthening hot rolled lead times is important as HRC has been the weakest of the flat rolled products due to the lethargic energy, agriculture and heavy equipment markets.
A side note: The data for both lead times and negotiations comes from only service center and manufacturer respondents. We do not include commentary from the steel mills, trading companies, or toll processors in this particular group of questions.
To see an interactive history of our Steel Mill Negotiations data, visit our website here.


