

Market Data

December 28, 2016
Manufacturing Update in December 2016
Written by Peter Wright
For the first time this month we will summarize six data sources that describe the state of manufacturing in the US. We have reported on most of these six sources separately in our Steel Market Update publications therefore will be brief in this summary. We don’t expect these data sources to all point in the same direction but our intention in summarizing them in one document is to try to get a consensus between them.
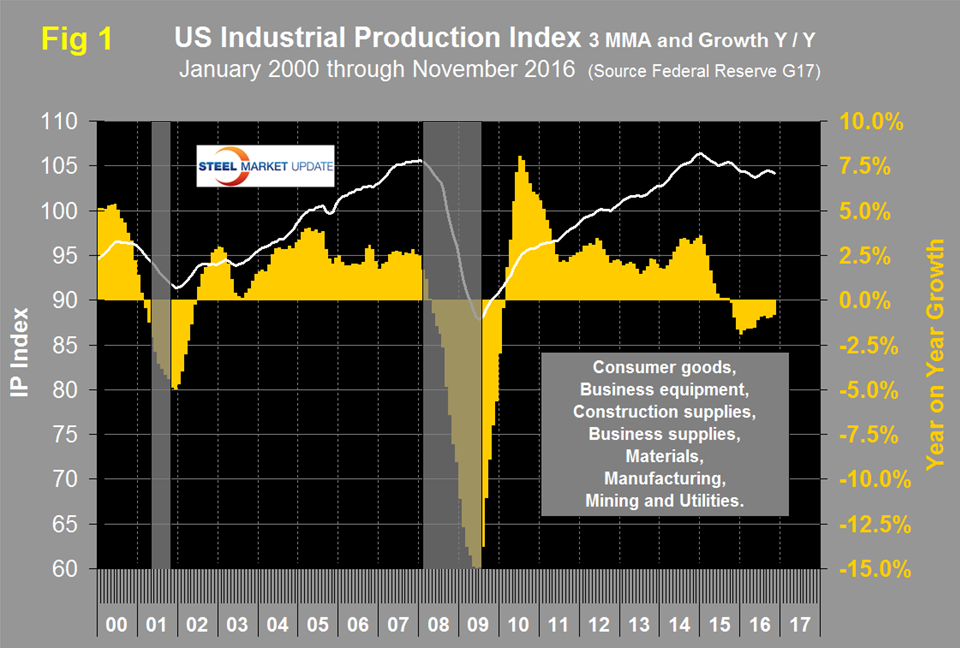
The Industrial Production Index: Figure 1 shows the IP index since January 2000 with the year/year growth. The index declined for all of 2015 through May of 2016 with a small net increase since then (white line). The y/y growth declined at the rate of 1.92 percent in January this year and has since improved to a contraction rate of 0.81 percent. Momentum has been positive every month since July last year.
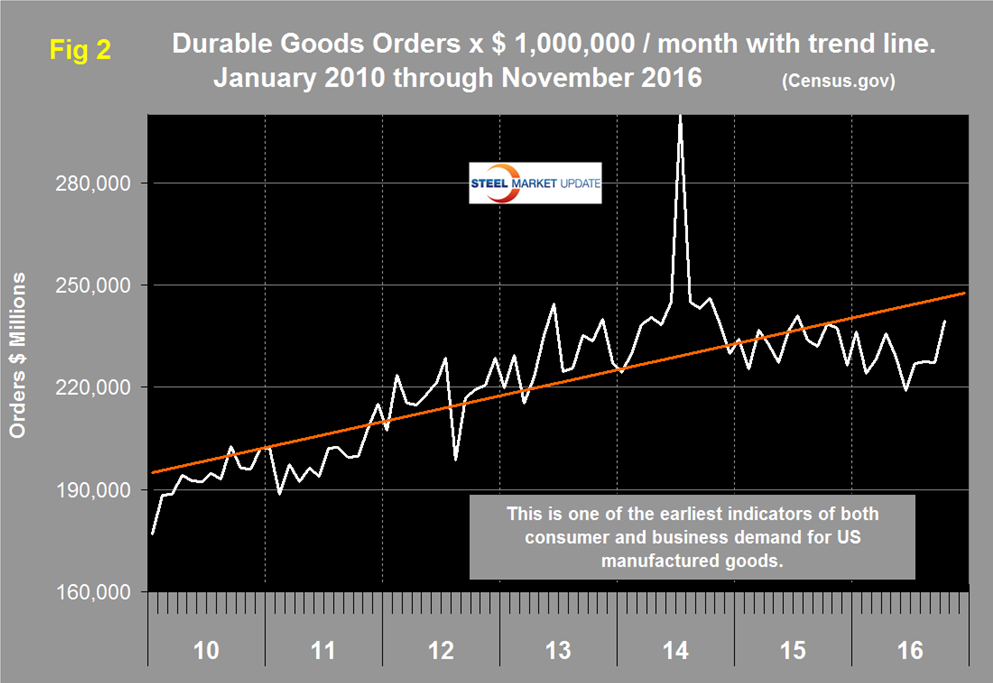
New orders for Durable Goods: Figure 2 shows the monthly orders for durable goods since January 2010 with the trend superimposed as the red line. The abnormal peak of August 2014 was a surge in civil aircraft orders. Apart from that anomaly DGs grew steadily through 2014, growth slowed in 2015, contracted in the first half of 2016 and has since picked up again.
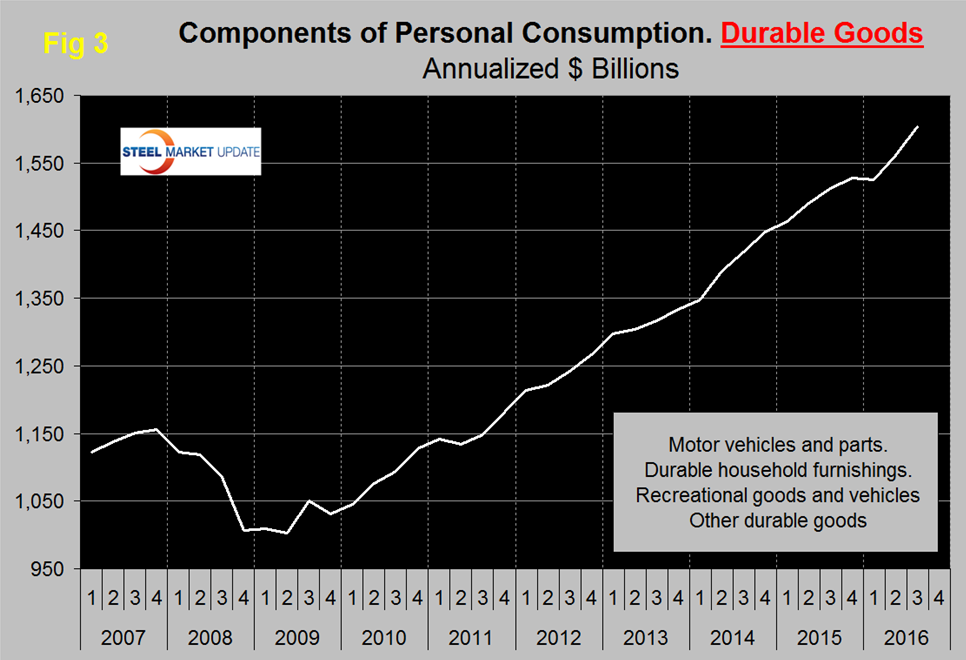
The Durable Goods portion of GDP: A subcomponent of the quarterly data for US GDP is durable goods which is part of the personal consumption calculation. It therefore contains no military hardware or civil aircraft data. This is shown in Figure 3 and presumably because of the exclusions just mentioned looks nothing like Figure 2. Durable goods manufactured for personal consumption have been on a healthy growth curve ever since the end of the recession with a slight blip at the end of 2015.
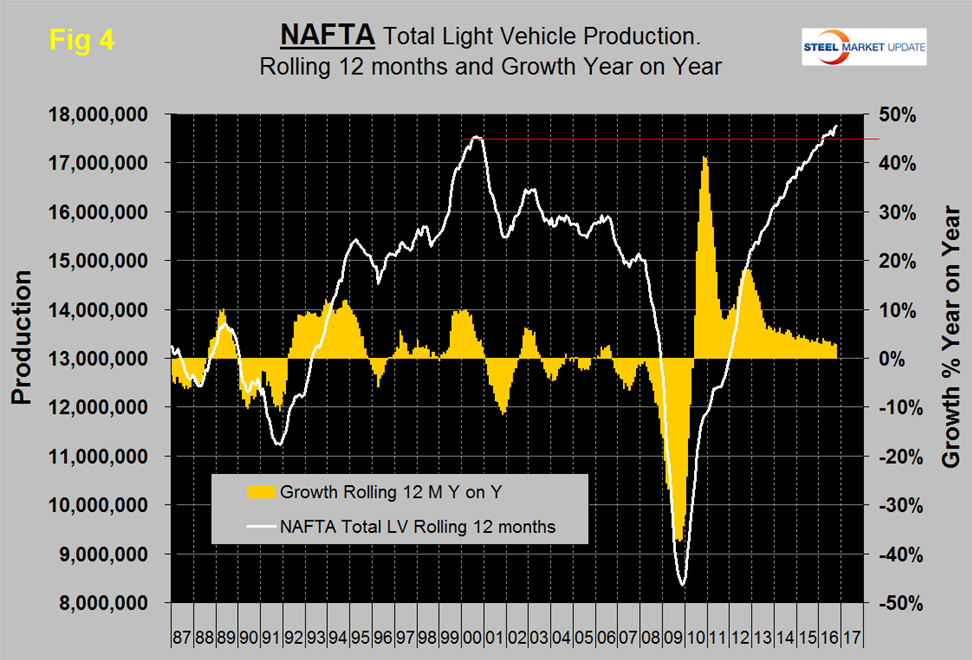
Auto Production in NAFTA is still experiencing a 2.9 percent y/y growth rate which considering that output is at an all-time high is good. The US component is growing at 2.0 percent y/y.
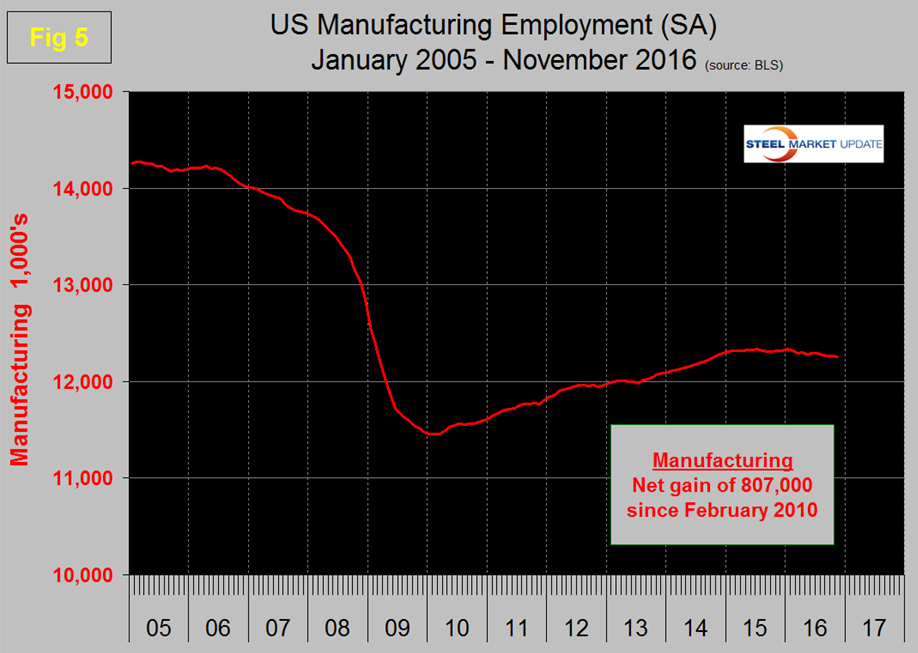
Manufacturing Employment dived during the recession and gradually improved from the spring of 2010 through 2014. Growth was flat in 2015 and became slightly negative in 2016, Figure 5. We don’t know quantitatively how labor productivity plays into this except that it is a major influence.
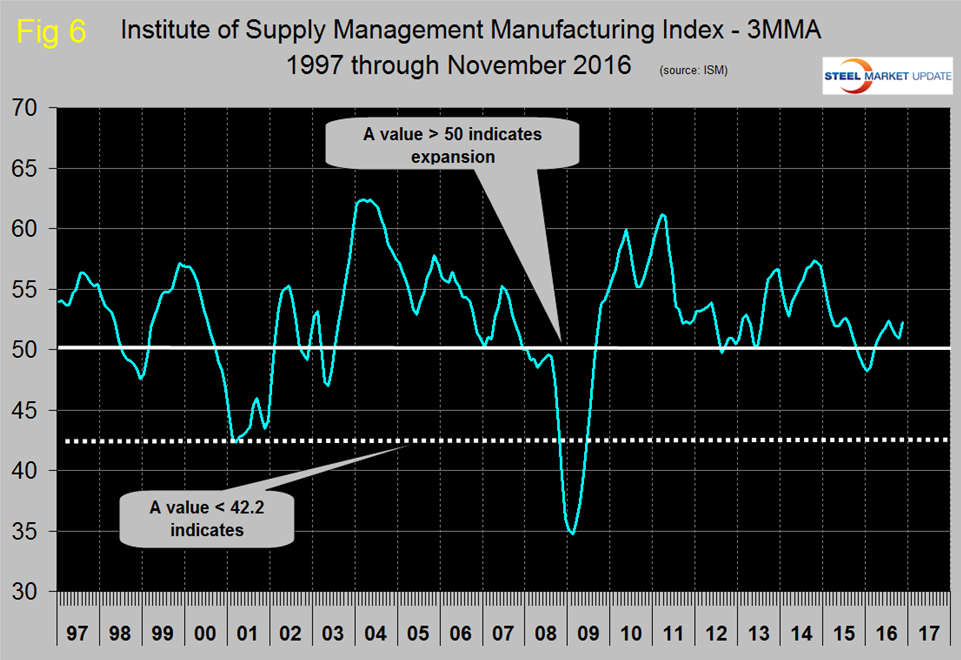
The ISM Manufacturing Index is a diffusion index. The Institute of Supply Management states that, “diffusion indexes have the properties of leading indicators and are convenient summary measures showing the prevailing direction of change and the scope of change. A PMI reading above 50 percent indicates that the manufacturing economy is generally expanding; below 50 percent indicates that it is generally declining.” Figure 6 shows the 3MMA of the ISM index from January 1997 through November 2016 and that there was a major improvement in the first half of this year. The index is currently signaling future expansion with a value of 53.2 in November.
SMU Comment: This is also the first time that we have ever seen these six indicators in one place and we are encouraged by the unexpected consistency in the data. In all cases except employment the data is improving. In the absence of a significant downward shift in employment we believe that the small decline is probably being driven by improved productivity, a trend that we expect will accelerate substantially in the next decade.
Overall we are encouraged by this analysis.


