

Prices

January 30, 2017
Global Steel Production in December and Forecast through 2017
Written by Peter Wright
Global steel production in 2016 was up by 0.9 percent after declining by 3.4 percent in 2015. On a rolling 12 month basis, December was the first month to have positive growth since May 2015.
Production in the month of December was 134,059,000 metric tons with a capacity utilization of 68.6 percent. The three month moving averages (3MMA) that we prefer to use were 134,322,000 and 69.3 percent respectively. Capacity is 2.35 billion tonnes per year. Figure 1 shows monthly production and capacity utilization since January 2000.
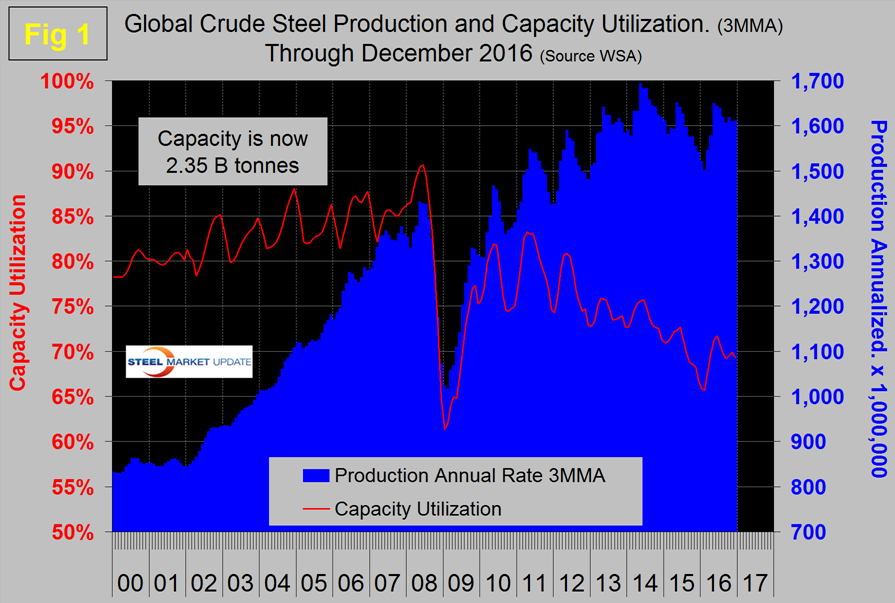
On a tons per day (t/d) basis, production in December was 4.324 million tonnes with a 3MMA of 4.380, down by 1.8 percent from November. Since 2011, capacity utilization has been on a steadily downward trajectory with a leveling out in the last four months. On October 9th the OECD’s steel committee reported that global capacity is expected to increase by almost 58 million tonnes per year between 2016 and 2018 bringing the total to 2.43 billion tonnes.
As we dig deeper into what is going on we start with seasonality. Global production has peaked in the summer for the last seven years including 2016. Figure 2 shows the average tons per day monthly production since 2008.
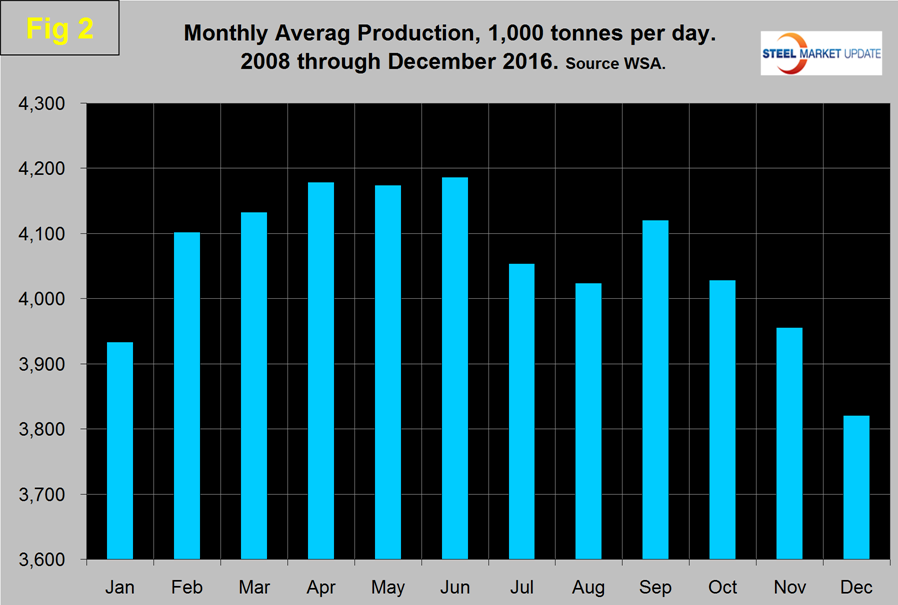
In those nine years on average, December has declined by 3.4 percent, this year December declined by 1.8 percent confirming the upward trend in production. We believe it’s necessary to look at the year over year change in the three month moving average to eliminate seasonality and on this basis December up by 4.5 percent. Figure 3 shows the monthly year over year growth rate on a 3MMA basis since January 2005.
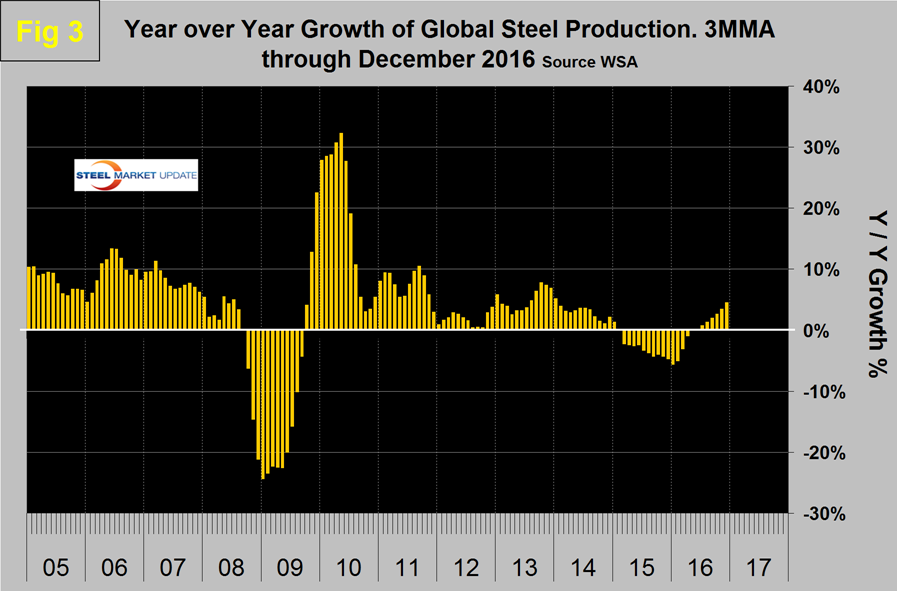
Production began to contract in March 2015 and the contraction accelerated through January 2016 when it reached 5.8 percent. In the next four months contraction slowed and in May and June was zero. Since then growth has accelerated every month to reach 4.5 percent in December. For the first time since August 2015, the rest of the world expanded faster than China with 5.0 percent and 4.1 percent growth rates respectively.
Table 1 shows global production broken down into regions and also the production of the top ten nations in the single month of December and their share of the global total. It also shows the latest three months and twelve months production through December with year over year growth rates for each period. Regions are shown in white font and individual nations in beige.
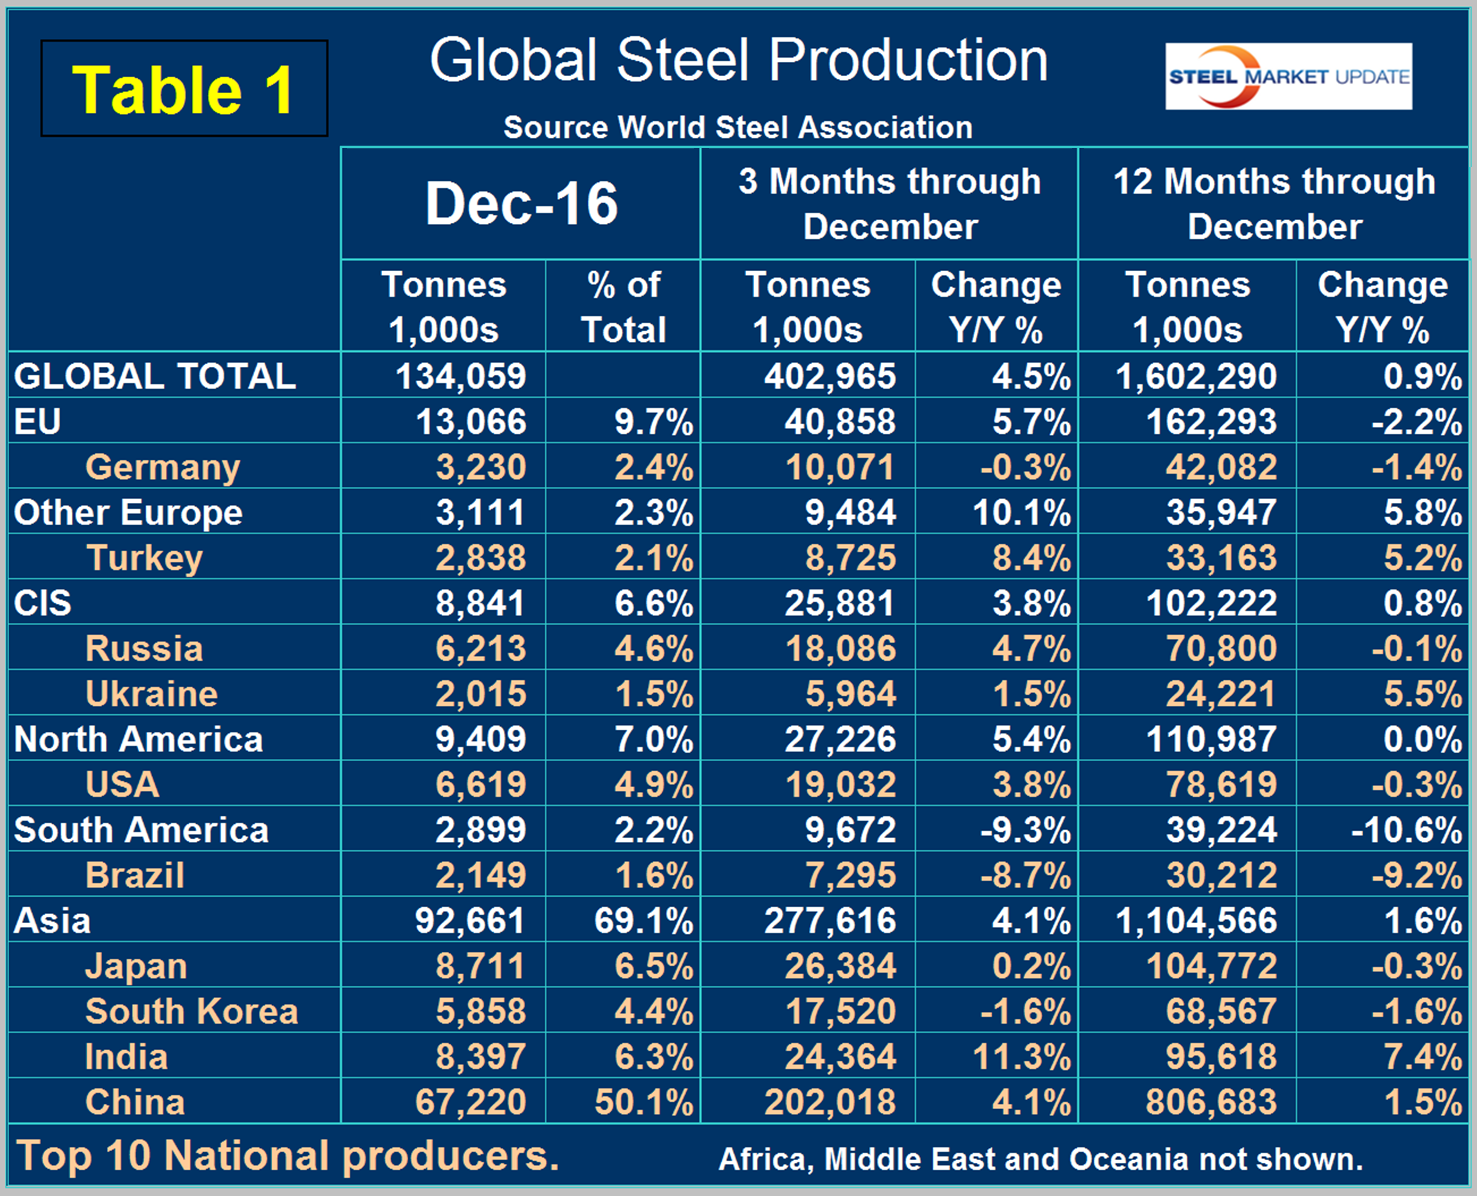
The world as a whole had positive growth of 4.5 percent in 3 months and 0.9 percent in 12 months through December. If the three month growth rate exceeds the twelve month we interpret this to be a sign of positive momentum which has been the case for the last eleven months. In December China accounted for 50.1 percent of the global total.
Figure 4 shows China’s production since 2005 and Figure 5 shows the y/y growth.
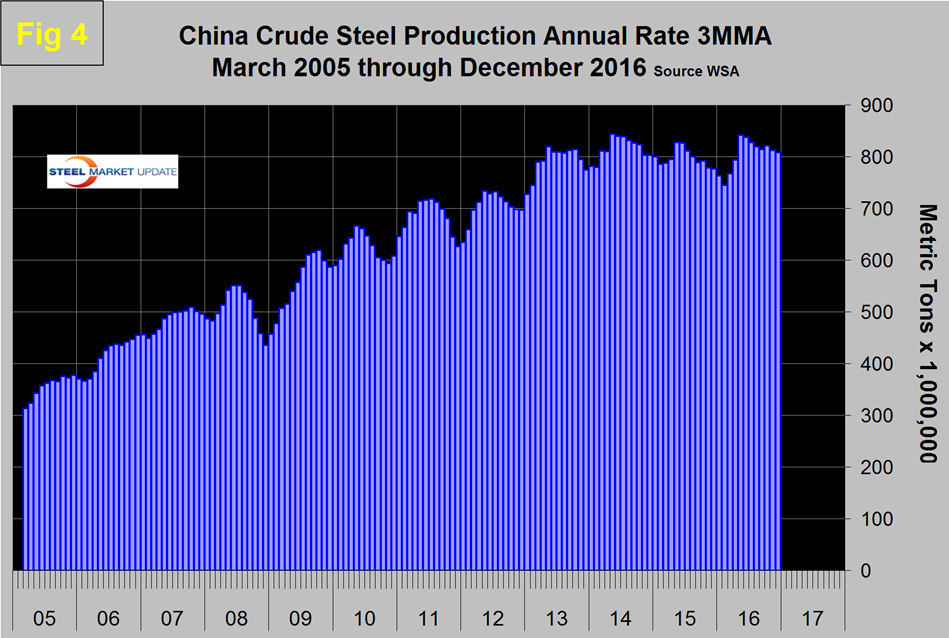
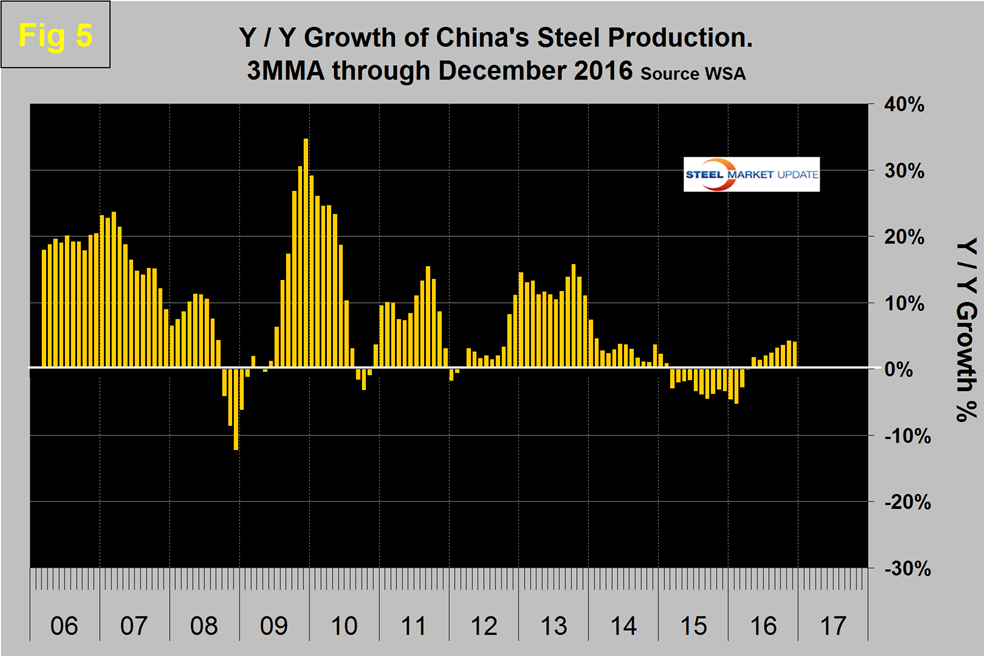
China’s production after slowing for 13 straight months on a 3MMA basis year over year returned to positive growth each month in May through November then declined slightly to 4.1 percent in December on a 3MMA year over year basis. The slowdown in Chinese steel production that the rest of the world has demanded is NOT happening and is in fact accelerating.
On a regional basis in 3 months through December year over year all except South America had positive growth. Asia as a whole was up by 4.1 percent with India up by 11.3 percent. Other Europe (mainly Turkey), was up by 10.1 percent and North America was up by 5.4 percent. Within North America the US was up by 3.8 percent, Canada was up by 0.5 percent and Mexico up by 23.3 percent.
The October 2016 version of the World Steel Association Short Range Outlook (SRO) for apparent steel consumption in 2016 and 2017 forecast a global growth of 0.2 percent in 2016 and 0.5 percent in 2017. Note this forecast is steel consumption, not crude steel production which is the main thrust of what you are reading now. As it turned out global production in 2016 beat this forecast which suggests that the surge in the 4th quarter was unexpected. Based on this forecast, NAFTA was supposed to contract by 0.1 percent in 2016 and it actually broke even. China’s demand was expected to decline by 1.0 percent in 2016 when in fact it grew by 1.5 percent and is forecast to grow by 2.0 percent in 2017. The WSA forecast for the top 10 steel producing nations has the US up 3.0 percent this year.
Source: World Steel Association with analysis by SMU.
SMU Comment: Global production returned to positive year over year growth in July and since then growth has accelerated to 4.5 percent. On the same basis China has accelerated to a 4.1 percent growth rate which will absorb some of the overcapacity but China is still exporting more than the total US steel production. An acceleration of plant closures will be necessary to make a real dent. At the same time new plants are coming on stream, the net result of closures and startups according to the OECD will be an additional 58 million tons of capacity by the end of 2018. To make matters worse the IMF is not optimistic about a pick up in global economic growth and the Chinese currency is weakening. The next forecast of global economic growth by the IMF will be reported in December.


