

Market Data

March 5, 2017
Key Market Indicators: A Remarkable Positive Surge in February
Written by Peter Wright
We at Steel Market Update (SMU) have been upbeat on the steel market for many weeks. We thought sharing our Key Market Indicators (KMI) with our readers would help everyone to understand our reading on the market and from where we get our core optimism.
An explanation of the Key Indicators concept is given at the end of this piece for those readers who are unfamiliar with it. This will explain the difference between our view of the present situation which is subjective and our analysis of trends which is based on the latest facts available. During February our view of the present situation improved slightly but there was a remarkable improvement in trends which were stronger than at any time since we began this analysis in January 2010. It is quite common for these two attributes to move independently as trends tend to lead the present situation by about four months.
![]() The total number of indicators considered in this analysis is 36.
The total number of indicators considered in this analysis is 36.
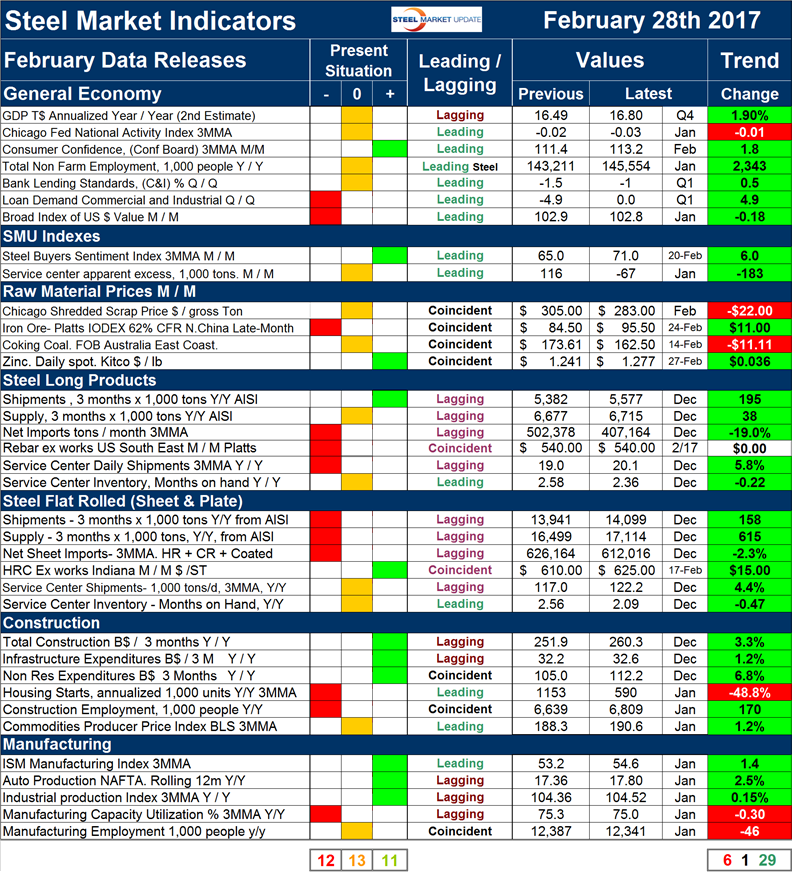
Please refer to Table 1 for the view of the present situation and the quantitative measure of trends. Readers should regard the color codes in the present situation column as a quick look at the current market condition. The “Trend” columns of Table 1 are also color coded to give a quick visual appreciation of the direction in which the market is headed. All data included in this table was released in February, the month or specific date to which the data refers is shown in the second column from the far right and all data is the latest available as of February 28, 2017.
Present Situation
There was an increase of one positive and a decrease of one neutral since we last published on January 31st. We currently view 11 of the 36 indicators as positive, 13 as neutral and 12 as negative. Our intent in using the word neutral is to say that this indicator is considered to be in the mid-range of historical data. An overall view of the color codes in the present situation columns show that in every section the present situation is mixed suggesting a market that is looking for direction. The change hat occurred in the last month was that shipments of long products were re-classified from neutral to positive as their volume broke through the threshold of 5,400,000 tons in 3 months. This data comes from the AISI and is in marked contrast to long product shipments from service centers as reported by the MSCI.
Figure 1 shows the change in our assessment of the present situation since January 2010 on a percentage basis.
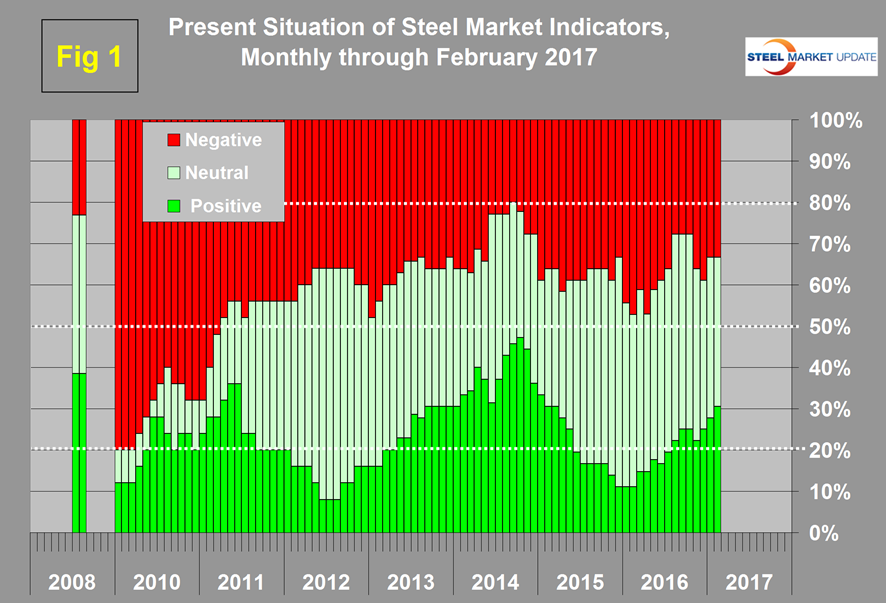
The number of indicators classified as positive peaked at 47.2 percent in October 2014 and steadily declined to 11.1 percent in the three months through last January. Since February 2016 there has been a steady increase in the number of indicators that we consider to be positive which reached 30.6 percent on February 28th. Based on the proportion of indicators that we consider positive, neutral and negative we have a present situation that is almost evenly split between these groups with plenty of room for improvement. The real point that we are trying to identify is, “Which way is it going.”
Trends
Most values in the trends columns are three month moving averages to smooth out what can be very erratic monthly data. The proportion of indicators trending positive through February 28, 2017 was 80.6 percent with 16.7 percent trending negative and 2.8 percent (one indicator) unchanged. This was a huge change from January and was the lowest proportion trending negative since our analysis was first performed in January 2010. In the last five months there has been a steady improvement through January and a remarkable positive surge in February. Figure 2 shows the trend of the trends and the pre-recession situation at the far left of the chart.
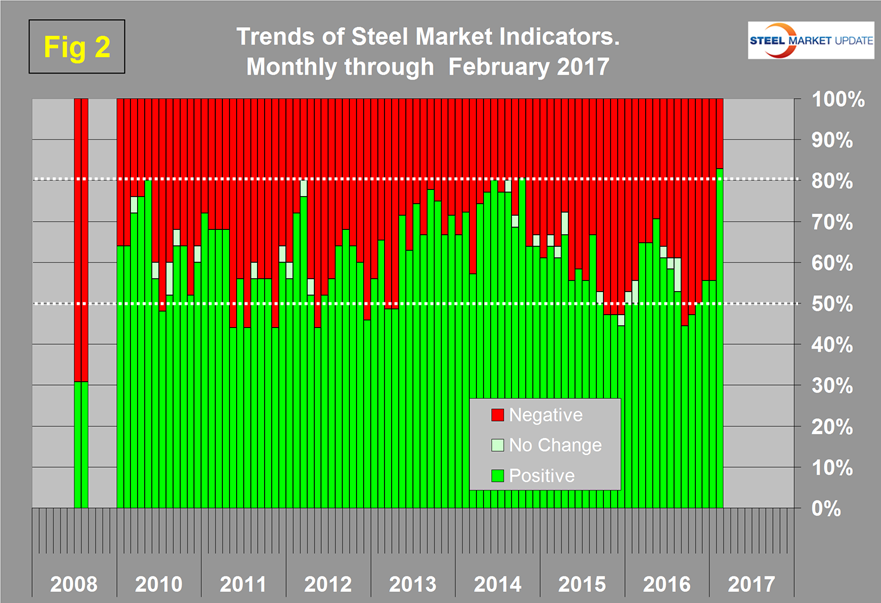
In August 2008 over 2/3 (69.2 percent) of our indicators were trending negative and the steel market crashed in September of that year.
Trend changes in the individual sectors since the end of January are described below. (Please note, in most cases this is not January data but data that was released in January for previous months.)
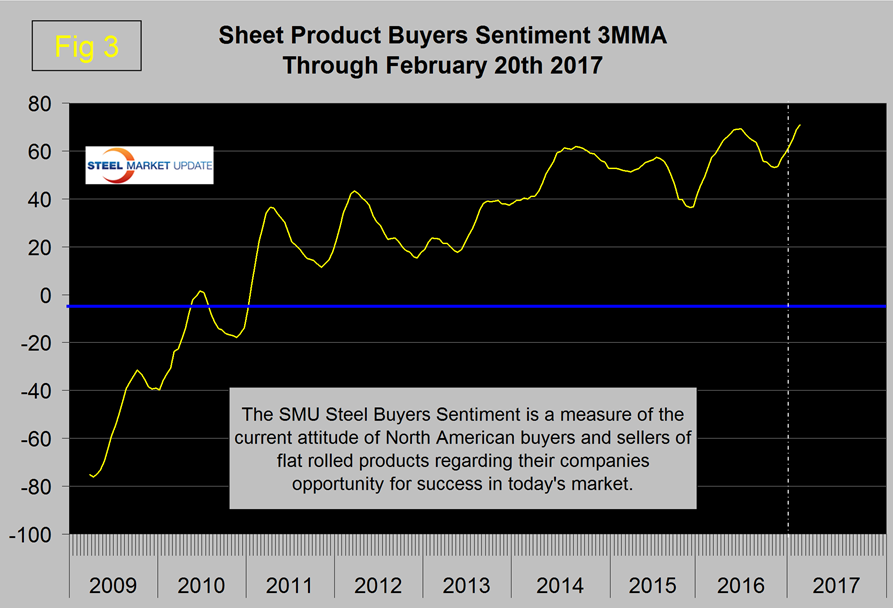
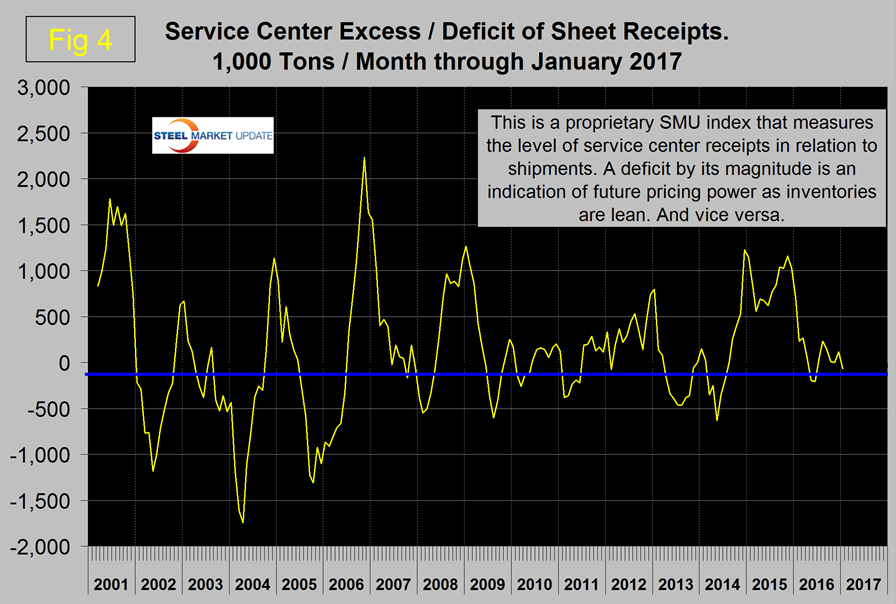
In the general economy, the Chicago fed national Activity Index reversed course and trended very slightly negative. Loan demand for commercial and industrial projects improved and the value of the US$ declined which we regard as a positive because of its effect on net imports. In the SMU index section, steel buyers sentiment continued to improve and reached an all-time high in mid-February (Figure 3) and service center excess reversed course and trended positive.
This is a proprietary SMU calculation. We regard an inventory surplus to be a sign of weak pricing power and at present there is a small deficit (Figure 4).
In the raw materials section the prices of iron ore and scrap both reversed course as scrap declined and iron ore increased. Word on the street is that scrap will be back up in March. We regard rising raw materials prices as positive and indicative of a strengthening market. The largest improvement in this whole analysis was the trends in both the long and flat steel sectors where all sub indicators are now trending positive except for the price of rebar which was unchanged. In the construction sector there were no trend reversals and in manufacturing the only change was in the industrial production index which trended positive in the January data.
We believe a continued examination of both the present situation and direction is a valuable tool for corporate business planning.
Explanation: The point of this analysis is to give both a quick visual appreciation of the market situation and a detailed description for those who want to dig deeper. It describes where we are now and the direction in which the market is headed and is designed to give a snapshot of the market on a specific date. The chart is stacked vertically to separate the primary indicators of the general economy, of proprietary Steel Market Update indices, of raw material prices, of both flat rolled and long product market indicators and finally of construction and manufacturing indicators. The indicators are classified as leading, coincident or lagging as shown in the third column.
Columns in the chart are designed to differentiate between where the market is today and the direction in which it is headed. Our evaluation of the present situation is subjectively based on our opinion of the historical value of each indicator. There is nothing subjective about the trends section which provides the latest facts available on the date of publication. It is quite possible for the present situation to be predominantly red and trends to be predominantly green and vice versa depending on the overall situation and direction of the market. The present situation is sub-divided into, below the historical norm (-) (OK), and above the historical norm (+). The “Values” section of the chart is a quantitative definition of the market’s direction. In most cases values are three month moving averages to eliminate noise. In cases where seasonality is an issue, the evaluation of market direction is made on a year over year comparison to eliminate this effect. Where seasonality is not an issue concurrent periods are compared. The date of the latest data is identified in the third values column. Values will always be current as of the date of publication. Finally the far right column quantifies the trend as a percentage or numerical change with color code classification to indicate positive or negative direction.


