

Market Data

March 31, 2017
Key Market Indicators through March 31, 2017
Written by Peter Wright
An explanation of the Key Indicators concept is given at the end of this piece for those readers who are unfamiliar with it. This will explain the difference between our view of the present situation which is subjective and our analysis of trends which is based on the latest facts available. During March our view of the present situation improved dramatically with the least number of negative indicators since we started this analysis in January 2010. The remarkable improvement in trends which occurred in February was maintained in March, both months having the least number of negatively trending indicators since January 2010.
![]() The total number of indicators considered in this analysis is 36.
The total number of indicators considered in this analysis is 36.
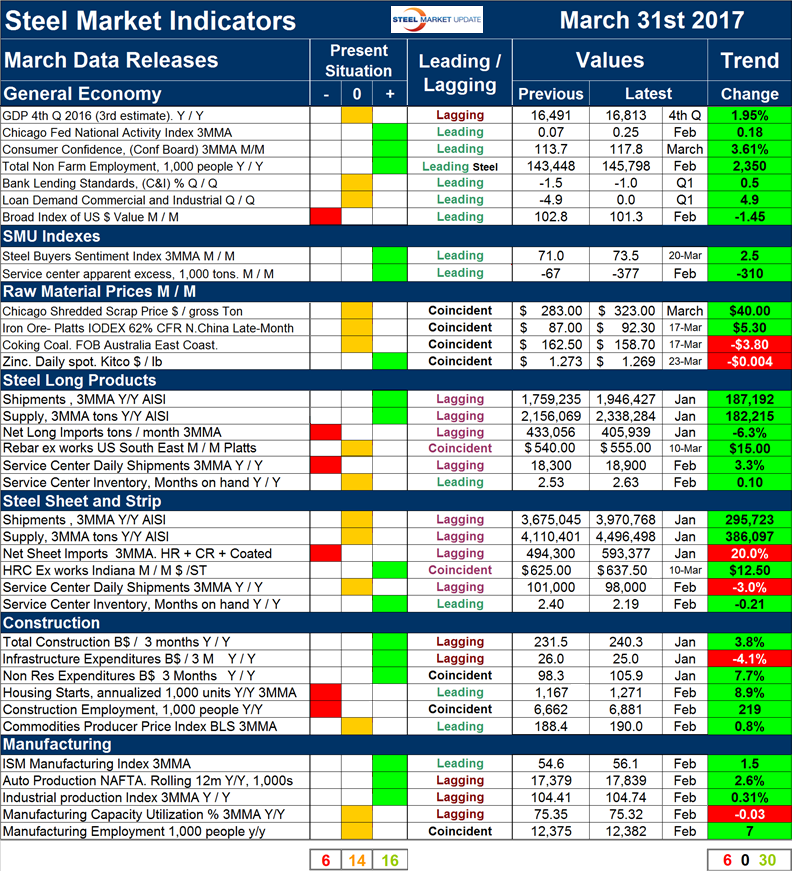
Please refer to Table 1 for the view of the present situation and the quantitative measure of trends. Readers should regard the color codes in the present situation column as a quick look at the current market condition. The “Trend” columns of Table 1 are also color coded to give a quick visual appreciation of the direction in which the market is headed. All data included in this table was released in March, the month or specific date to which the data refers is shown in the second column from the far right and all data is the latest available as of March 31st, 2017.
Present Situation
There was an increase of five indicators that we consider to be positive, an increase of one neutral and a decrease of six negatives since we last published on February 28th. We currently view 16 of the 36 indicators as positive, 14 as neutral and 6 as negative. Our intent in using the word neutral is to say that this indicator is considered to be in the mid-range of historical data.
Figure 1 shows our monthly assessment of the present situation since January 2010 on a percentage basis.
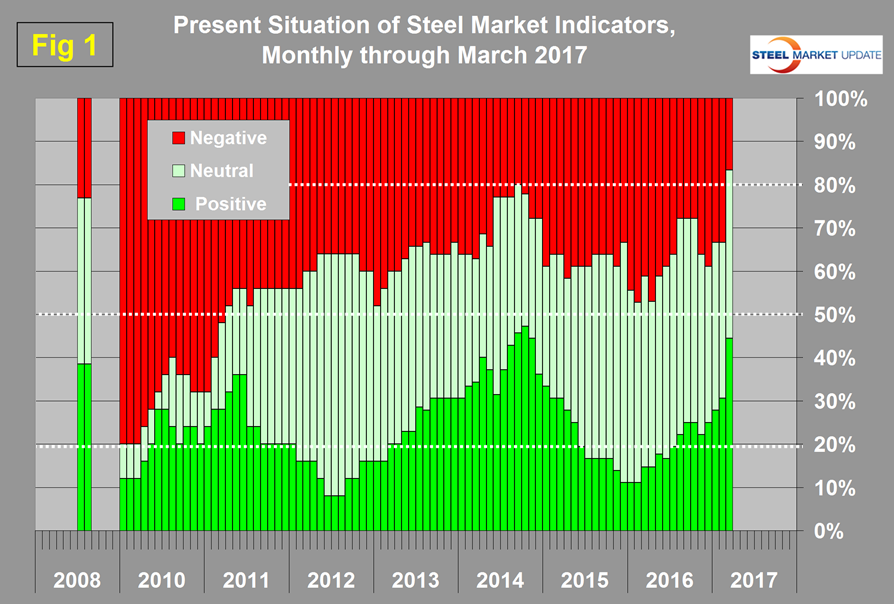
The number of indicators classified as positive peaked at 47.2 percent in October 2014 and steadily declined to 11.1 percent in the three months through January 2016. Since February 2016 there was a steady increase in the number of indicators that we consider to be positive which reached 44.4 percent on March 31st. The combination of positive and neutral indicators in March was the highest ever at 83.3 percent.
In the General Economy section, the only indicator that we regard as a negative driver is the value of the US $ which by virtue of its strength is increasing net imports across the whole economy. The sheet market is better than that of long products which continue to suffer a low shipment volume from service centers. Both steel sectors continue to have a high level of net imports.
Trends
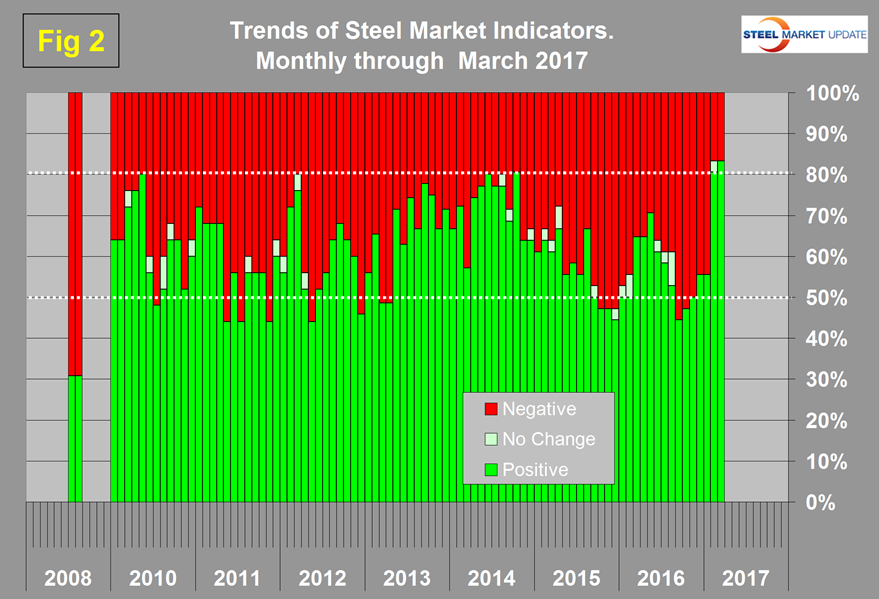
Most values in the trends columns are three month moving averages to smooth out what can be very erratic monthly data. The proportion of indicators trending positive through March 31st was 83.3 percent (30 of 36). This was the best result since our data was first compiled. In the four months October through January there was a steady improvement followed by a surge in February that was sustained in March. Figure 2 shows the trend of the trends and the pre-recession situation at the far left of the chart. In August 2008 over 2/3 (69.2 percent) of our indicators were trending negative and the steel market crashed in September of that year.
Trend changes in the individual sectors since the end of February are described below together with some general comments. (Please note in most cases this is not March data but data that was released in March for previous months.)
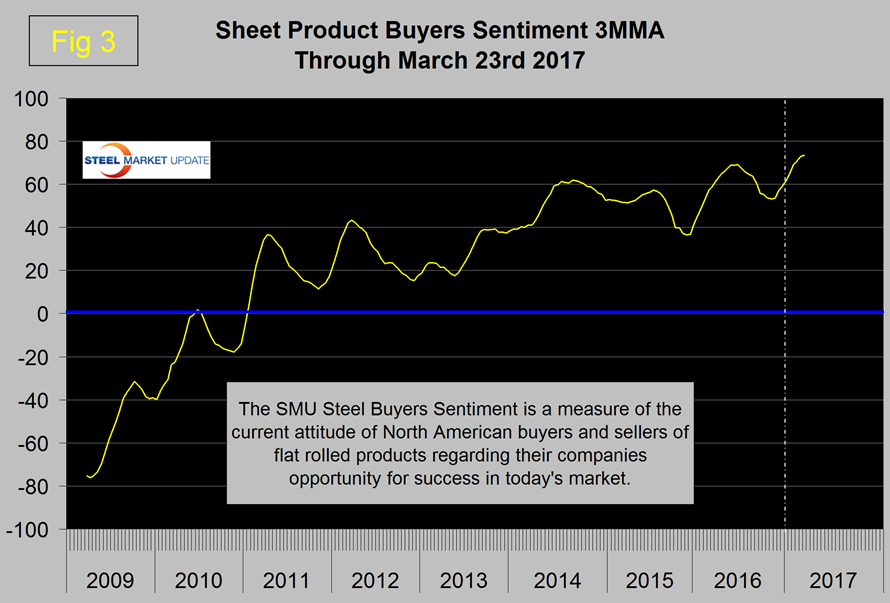
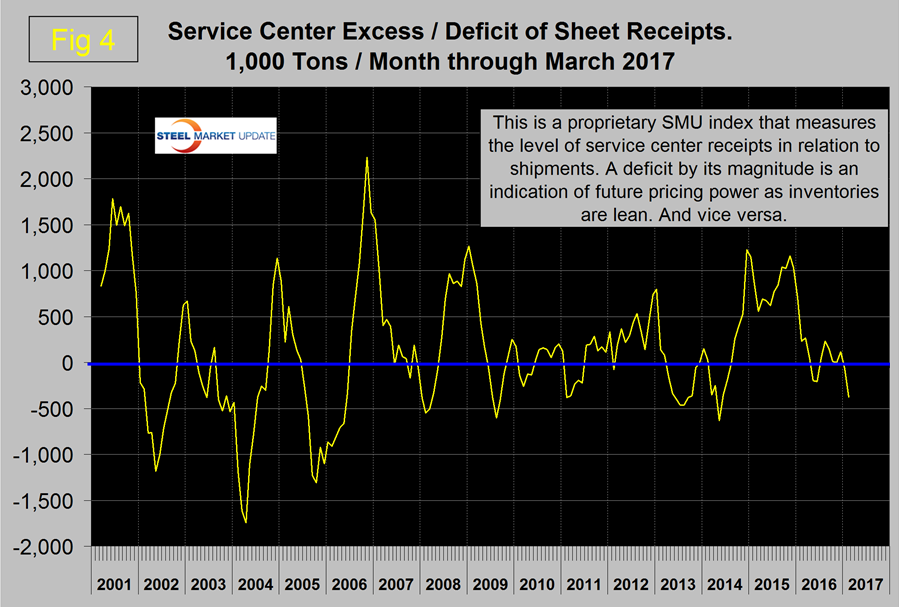
In the general economy, the Chicago Fed. National Activity Index reversed course and trended positive and had its best value since December 2014. The CFNAI is a weighted average of 85 existing monthly indicators of national economic activity. In the SMU index section, steel buyers sentiment continued to improve and reached another all time high in mid March (Figure 3) and service center excess of sheet products became negative in January and increasingly so in February.
This is a proprietary SMU calculation. We regard an inventory deficit to be positive in terms of pricing power and in February there was a deficit of 377,000 tons (Figure 4).
In the raw materials section the prices of scrap reversed course and increased as the price of zinc trended slightly negative. We regard rising raw materials prices as positive and indicative of a strengthening market. In the sheet and strip section, net imports reversed course and increased and service center shipments became negative year/year. In the construction sector, infrastructure expenditures trended negative and housing starts trended positive, both were reversals. In manufacturing the only change was in the number employed which trended positive in February.
We believe a continued examination of both the present situation and direction is a valuable tool for corporate business planning.
Explanation: The point of this analysis is to give both a quick visual appreciation of the market situation and a detailed description for those who want to dig deeper. It describes where we are now and the direction in which the market is headed and is designed to describe the market on a specific date. The chart is stacked vertically to separate the primary indicators of the general economy, of proprietary Steel Market Update indices, of raw material prices, of both sheet and long product market indicators and finally of construction and manufacturing indicators. The indicators are classified as leading, coincident or lagging as shown in the third column.
Columns in the chart are designed to differentiate between where the market is today and the direction in which it is headed. Our evaluation of the present situation is subjectively based on our opinion of the historical value of each indicator. There is nothing subjective about the trends section which provides the latest facts available on the date of publication. It is quite possible for the present situation to be predominantly red and trends to be predominantly green and vice versa depending on the overall situation and direction of the market. The present situation is sub-divided into, below the historical norm (-) (OK), and above the historical norm (+). The “Values” section of the chart is a quantitative definition of the market’s direction. In most cases values are three month moving averages to eliminate noise. In cases where seasonality is an issue, the evaluation of market direction is made on a year over year comparison to eliminate this effect. Where seasonality is not an issue concurrent periods are compared. The date of the latest data is identified in the third values column. Values will always be current as of the date of publication. Finally the far right column quantifies the trend as a percentage or numerical change with color code classification to indicate positive or negative direction.


