

Prices

June 14, 2017
April Apparent Steel Supply Remains High, Over 9 Million Tons
Written by Brett Linton
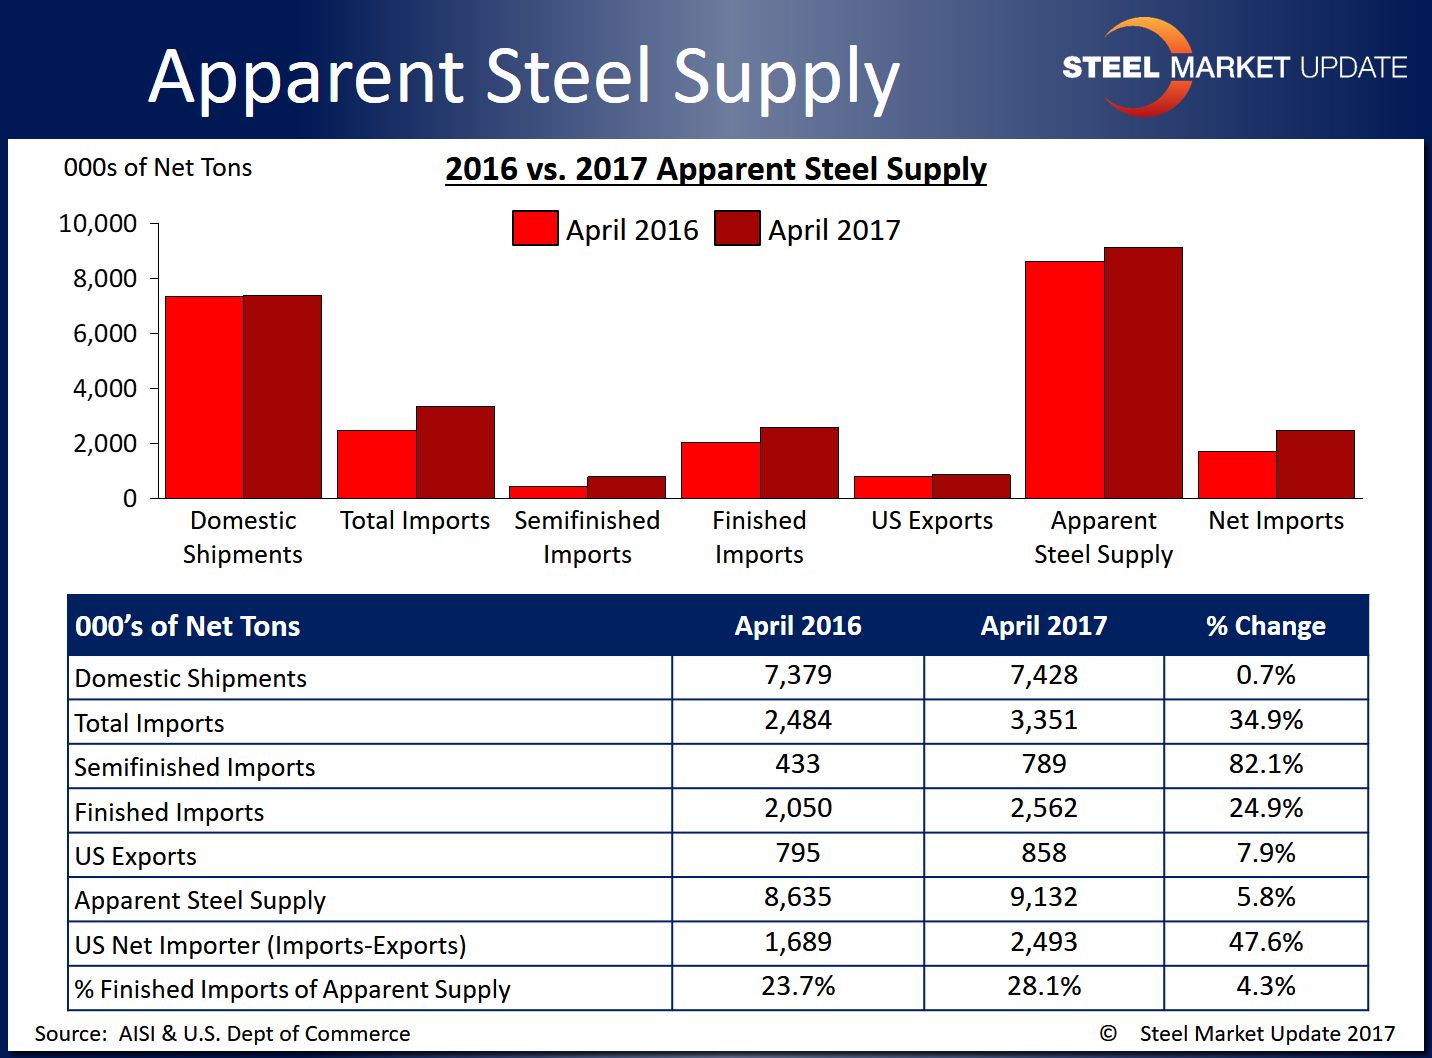
Apparent steel supply for the month of April totaled 9,132,068 net tons, according to the latest data released from the U.S. Department of Commerce and the American Iron and Steel Institute. Apparent steel supply is calculated by adding domestic steel shipments and finished U.S. steel imports, then subtracting total U.S. steel exports.
While down over March, we want to remind our readers that the April apparent steel supply figure is still high in comparison to the last year or so. Last month, we saw the highest apparent steel supply level seen since July 2015. You can view our full apparent steel supply history on the Steel Market Update website in the Import/Export Data section.
April apparent steel supply represents a 497,151 ton or 5.8 percent increase compared to the same month one year ago. The majority of this change came from an increase in finished imports, increasing 511,446 tons or 24.9 percent. Domestic shipments were relatively flat, up 48,750 tons or 0.7 percent. Total exports lessened the overall rise in apparent steel supply as they rose 63,046 or 7.9 percent.
The net trade balance between U.S. steel imports and exports was a surplus of +2,493,401 tons imported in April, up from +2,470,376 tons last month and up from 1,689,044 tons one year ago. This is the highest net trade balance seen since July 2016 when it was 2,527,953 tons. Foreign steel imports accounted for 28.1 percent of apparent steel supply in April, up 4.3 percent over the same month one year ago.
When compared to last month, when apparent steel supply was 9,300,718 tons and at a 1.5 year high, April supply decreased by 168,649 tons or 1.8 percent. This was primarily due to a decrease in domestic imports, which fell 264,354 tons or 3.4 percent. Finished imports were nearly flat month over month, up 4,680 tons or 0.2 percent. Total exports in declined 91,024 tons or 9.6 percent over March, which slightly negated the overall decrease in apparent steel supply.
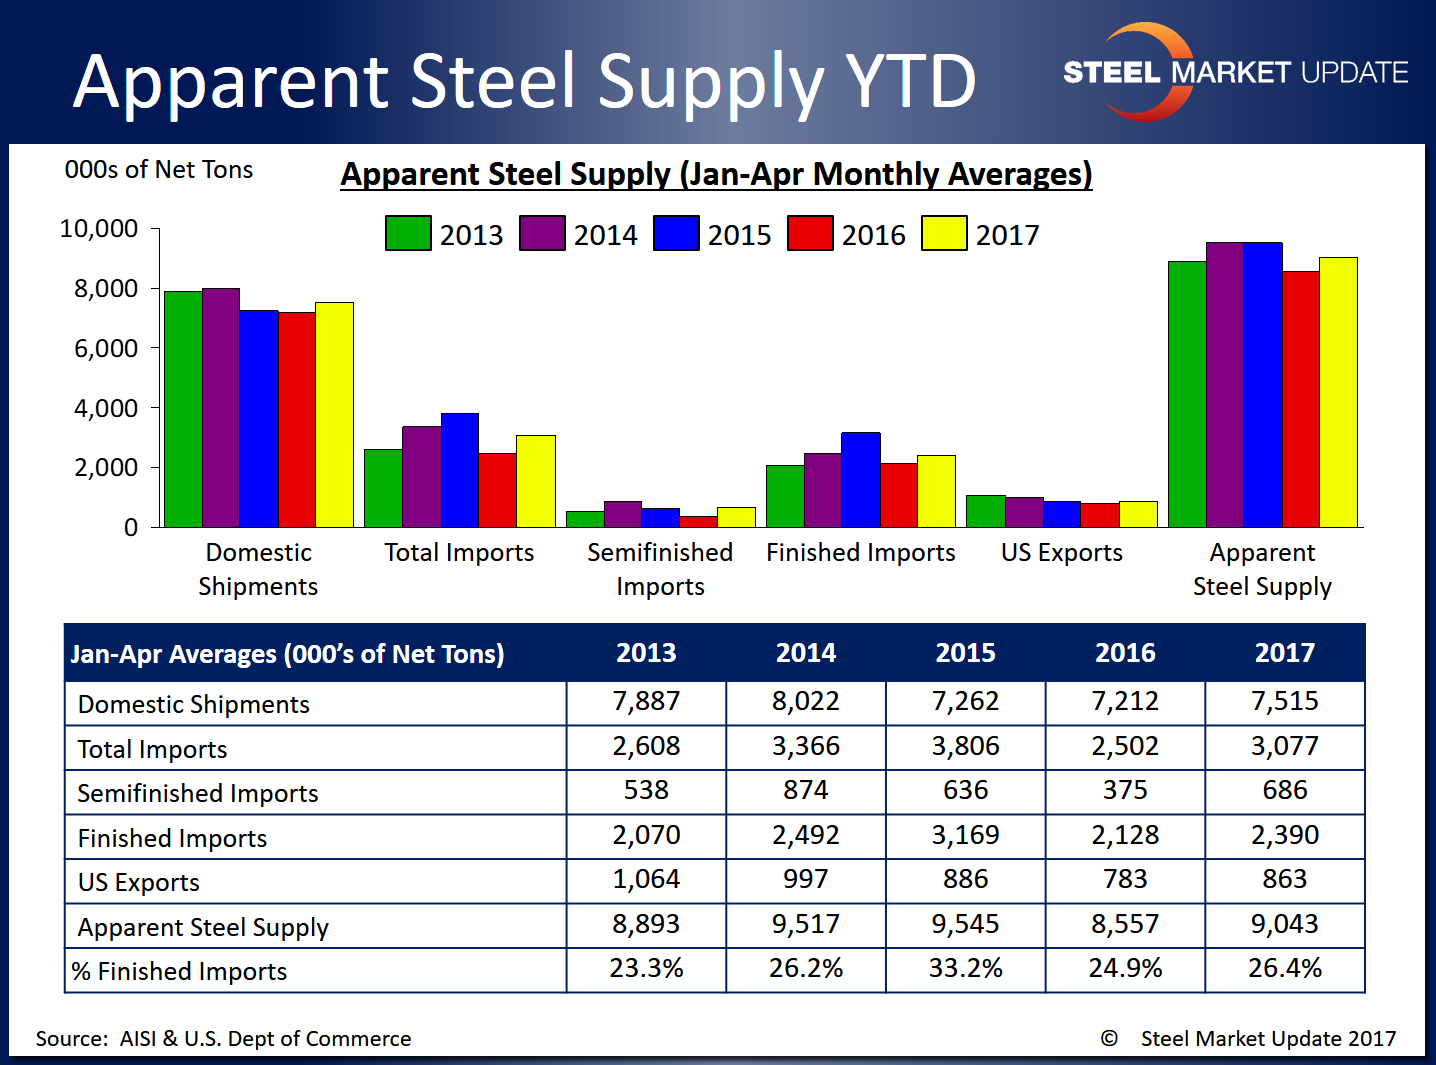
The table below shows year-to-date totals for each statistic over the last five years. Note that these averages are calculated through the first four months of each year for an equal comparison. As was the case last month, the 2017 data points are higher than the 2016 figures, but are mixed compared to 2013-2015 data for all items listed.
To see an interactive graphic of our Apparent Steel Supply history, visit the Apparent Steel Supply page in the Analysis section of the SMU website. If you need any assistance logging in or navigating the website, contact us at info@SteelMarketUpdate.com or 800-432-3475.


