Prices

June 28, 2017
Global Steel Production in May, Forecast Through 2018
Written by Peter Wright
Global steel production in May was 143,325,000 metric tons, up from 142,060,000 tons in April. Capacity utilization was 71.8 percent in May. The three-month moving averages (3MMA) that we prefer to use were 142,957,000 and 72.4 percent, respectively. Capacity is 2.35 billion metric tons per year. Figure 1 shows monthly production and capacity utilization since May 2000.
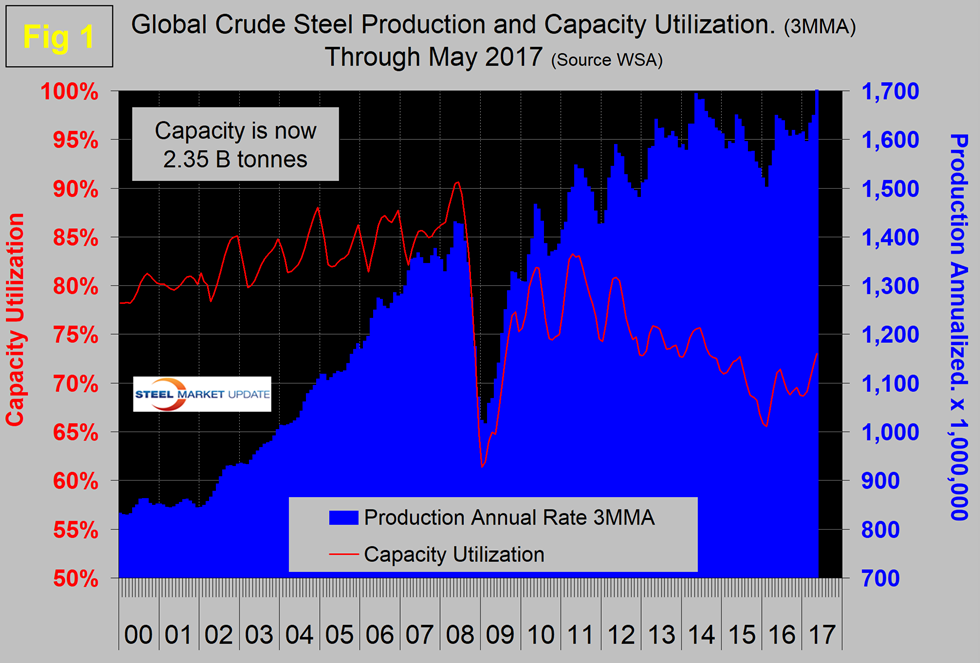
On a tons per day basis, production in May was 4.623 million tonnes with a 3MMA of 4.662, which was another all-time high. In three months through May, production was up by 3.9 percent year over year. Capacity utilization had an erratically downward trajectory from mid 2011 through mid 2016, but that may be changing as a turnaround seems to be developing. On October 9, the OECD’s steel committee reported that global capacity is expected to increase by almost 58 million tonnes per year between 2016 and 2018, bringing the total to 2.43 billion tonnes.
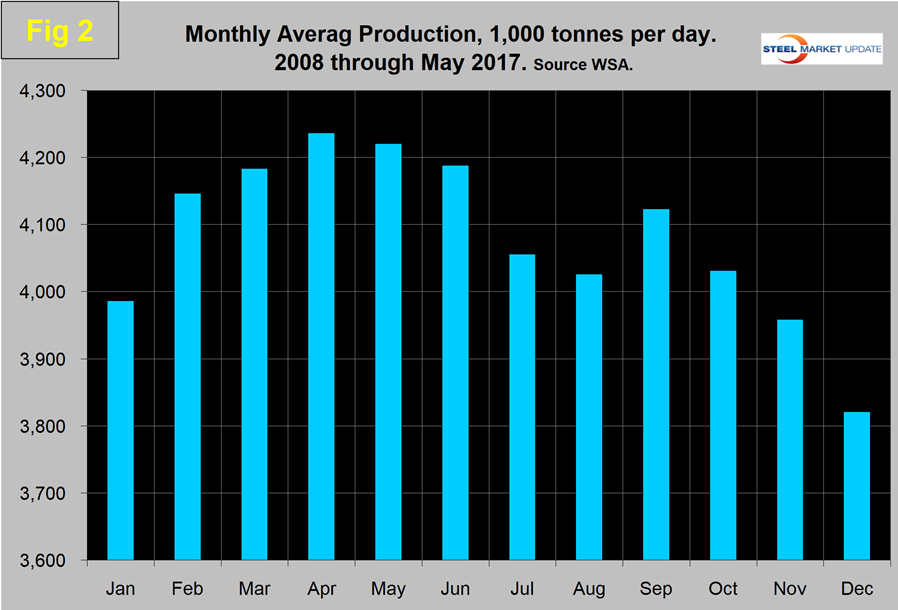
As we dig deeper into what is going on, we start with seasonality. Global production has peaked in the early summer for the last seven years with April on average having the highest volume. Figure 2 shows the average tons per day production for each month since 2008.
In those 10 years on average, May has been down by 0.38 percent; this year May declined by 2.36 percent. Figure 3 shows the monthly year-over-year growth rate on a 3MMA basis since January 2005.
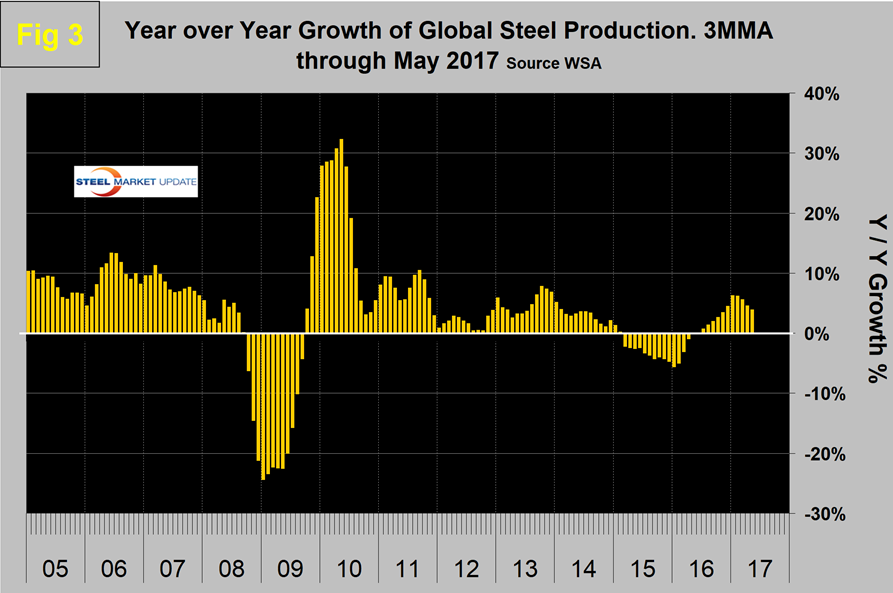
Production began to contract in March 2015, and the contraction accelerated through January 2016 when it reached negative 5.6 percent. Growth improved every month through January this year when it reached positive 6.3 percent. Growth slowed to 5.6 percent in March, 4.6 percent in April and 3.9 percent in May, respectively. For the last six months, China’s growth rate has been lower than the rest of the world. A welcome sign that, if it becomes a long-term trend, will take some pressure off the global market.
Table 1 shows global production broken down into regions, the production of the top 10 nations in the single month of May and their share of the global total. It also shows the latest three months and twelve months production through May with year-over-year growth rates for each period. Regions are shown in white font and individual nations in beige.
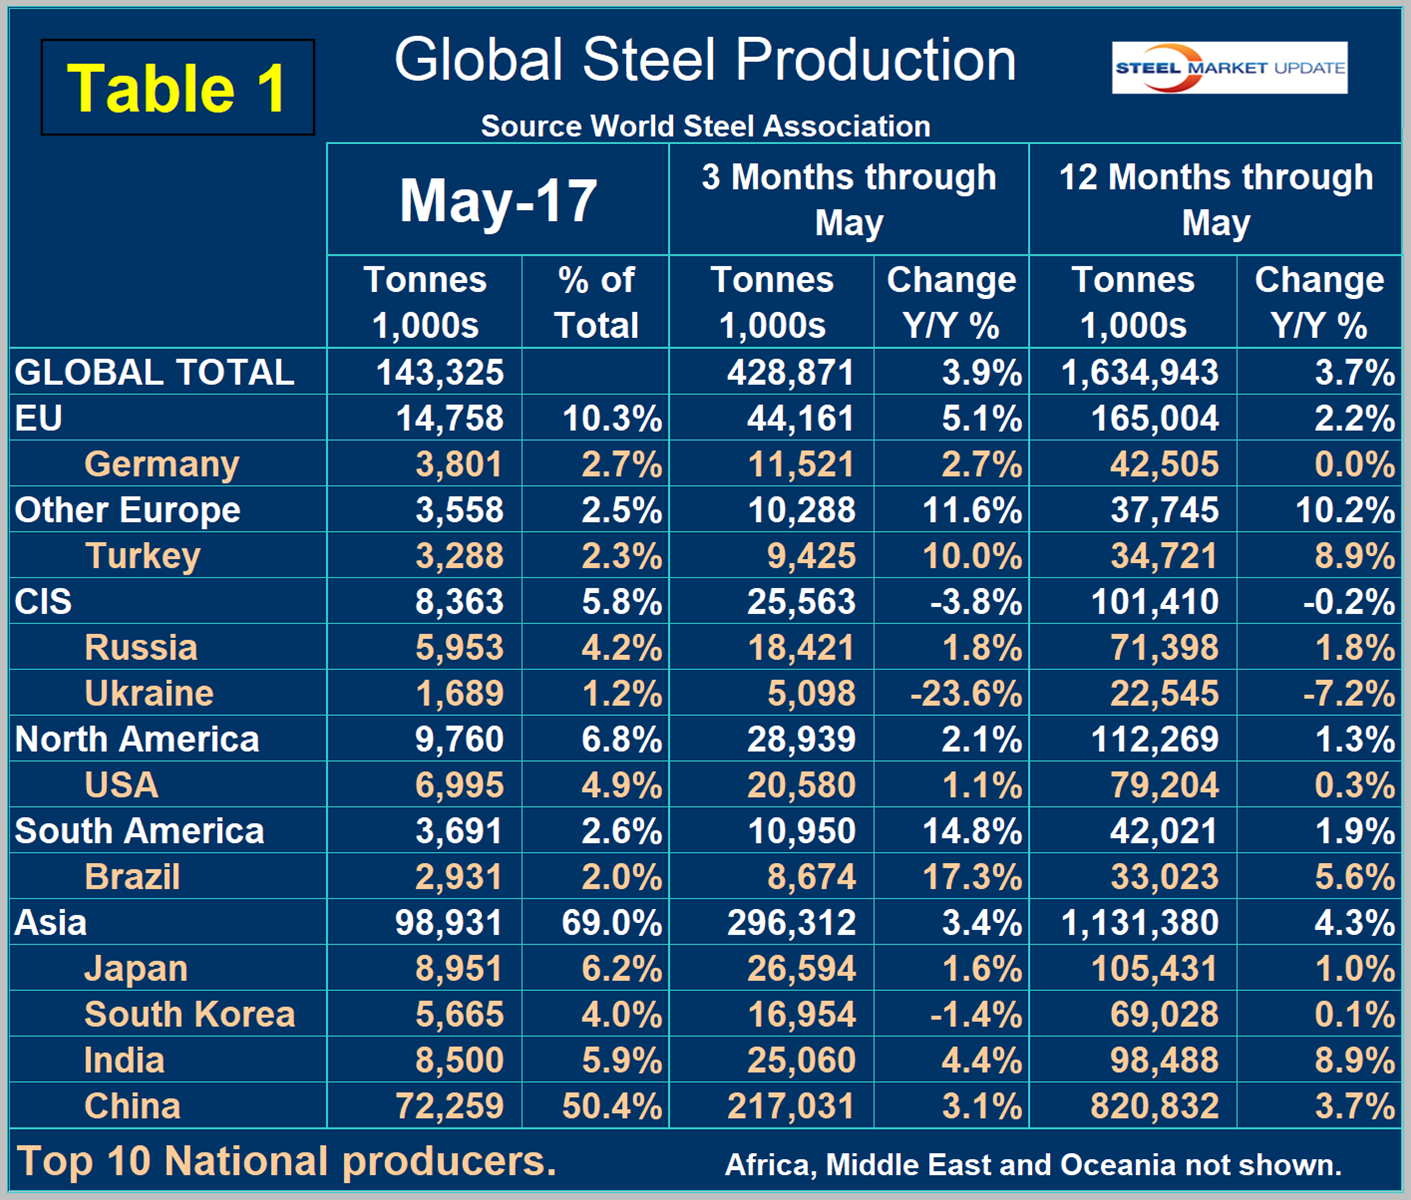
The world as a whole had positive growth of 3.9 percent in three months and 3.7 percent in twelve months through May. If the three-month growth rate exceeds the twelve-month, we interpret this as a sign of positive momentum, which has been the case for the last 16 months. In May, China’s share of global production was 50.4 percent. Vietnam doesn’t appear in Table 1 and wasn’t even recognized as a producer by the World Steel Association until January last year. Vietnam has seen its production grow from 407,000 tons in January last year to 755,000 tons in May this year. This may be another piece of the puzzle that describes the re-processing and export of Chinese hot rolled coil. In Q1 this year, Vietnam imported HRC at an annual rate of 11,000,000 tons, which was by far the highest of all importing nations and nearly all from China.
Figure 4 shows China’s production since 2005 and Figure 5 shows the year/year growth.
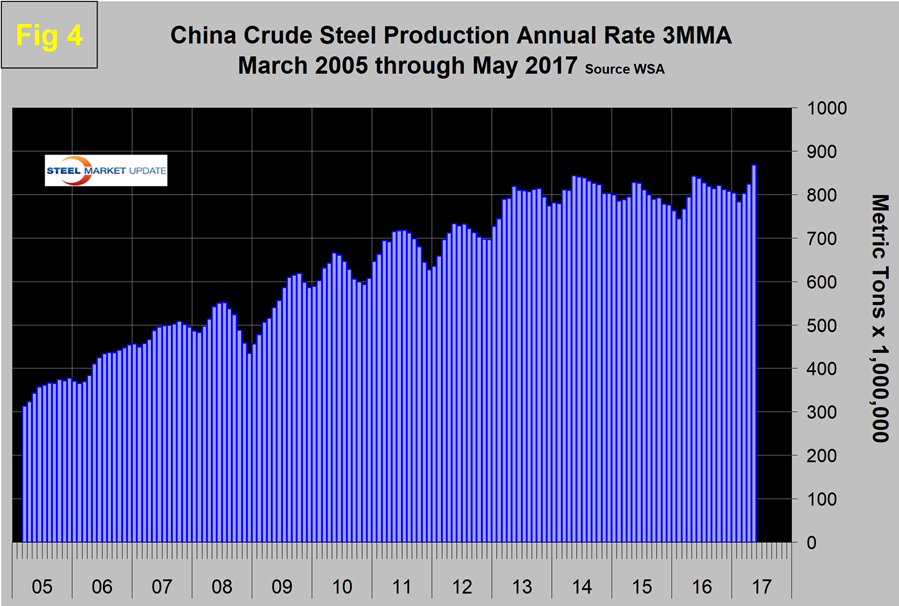
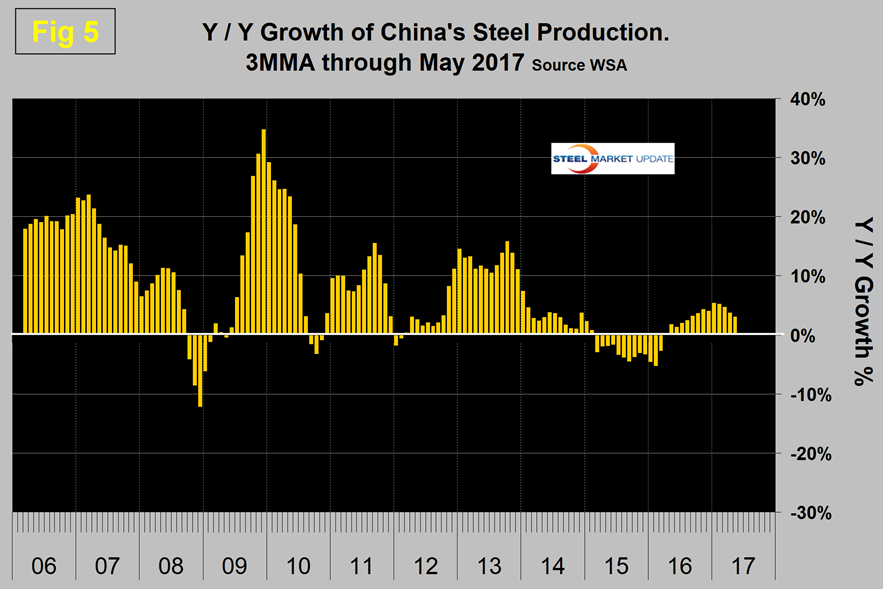
China’s production, after slowing for 13 straight months year over year, returned to positive growth each month from May 2016 through May this year on a 3MMA basis. It may look from Figure 4 as though China’s production was falling through February, but on a year-over-year basis this was not the case. Therefore the slowdown in Chinese steel production that they have been promising is not happening.
In three months through May year-over-year, every region had positive growth, except the CIS, which was dragged down by Ukraine. South America, led by Brazil, had the highest growth rate in three months through May, followed by other Europe led by Turkey. Asia as a whole was up by 3.4 percent. North America was up by 2.1 percent. Within North America the U.S. was up by 1.1 percent, Canada was up by 0.3 percent and Mexico was up by 8.4 percent. In first-quarter 2017, Mexico produced 25 percent more steel than Canada.
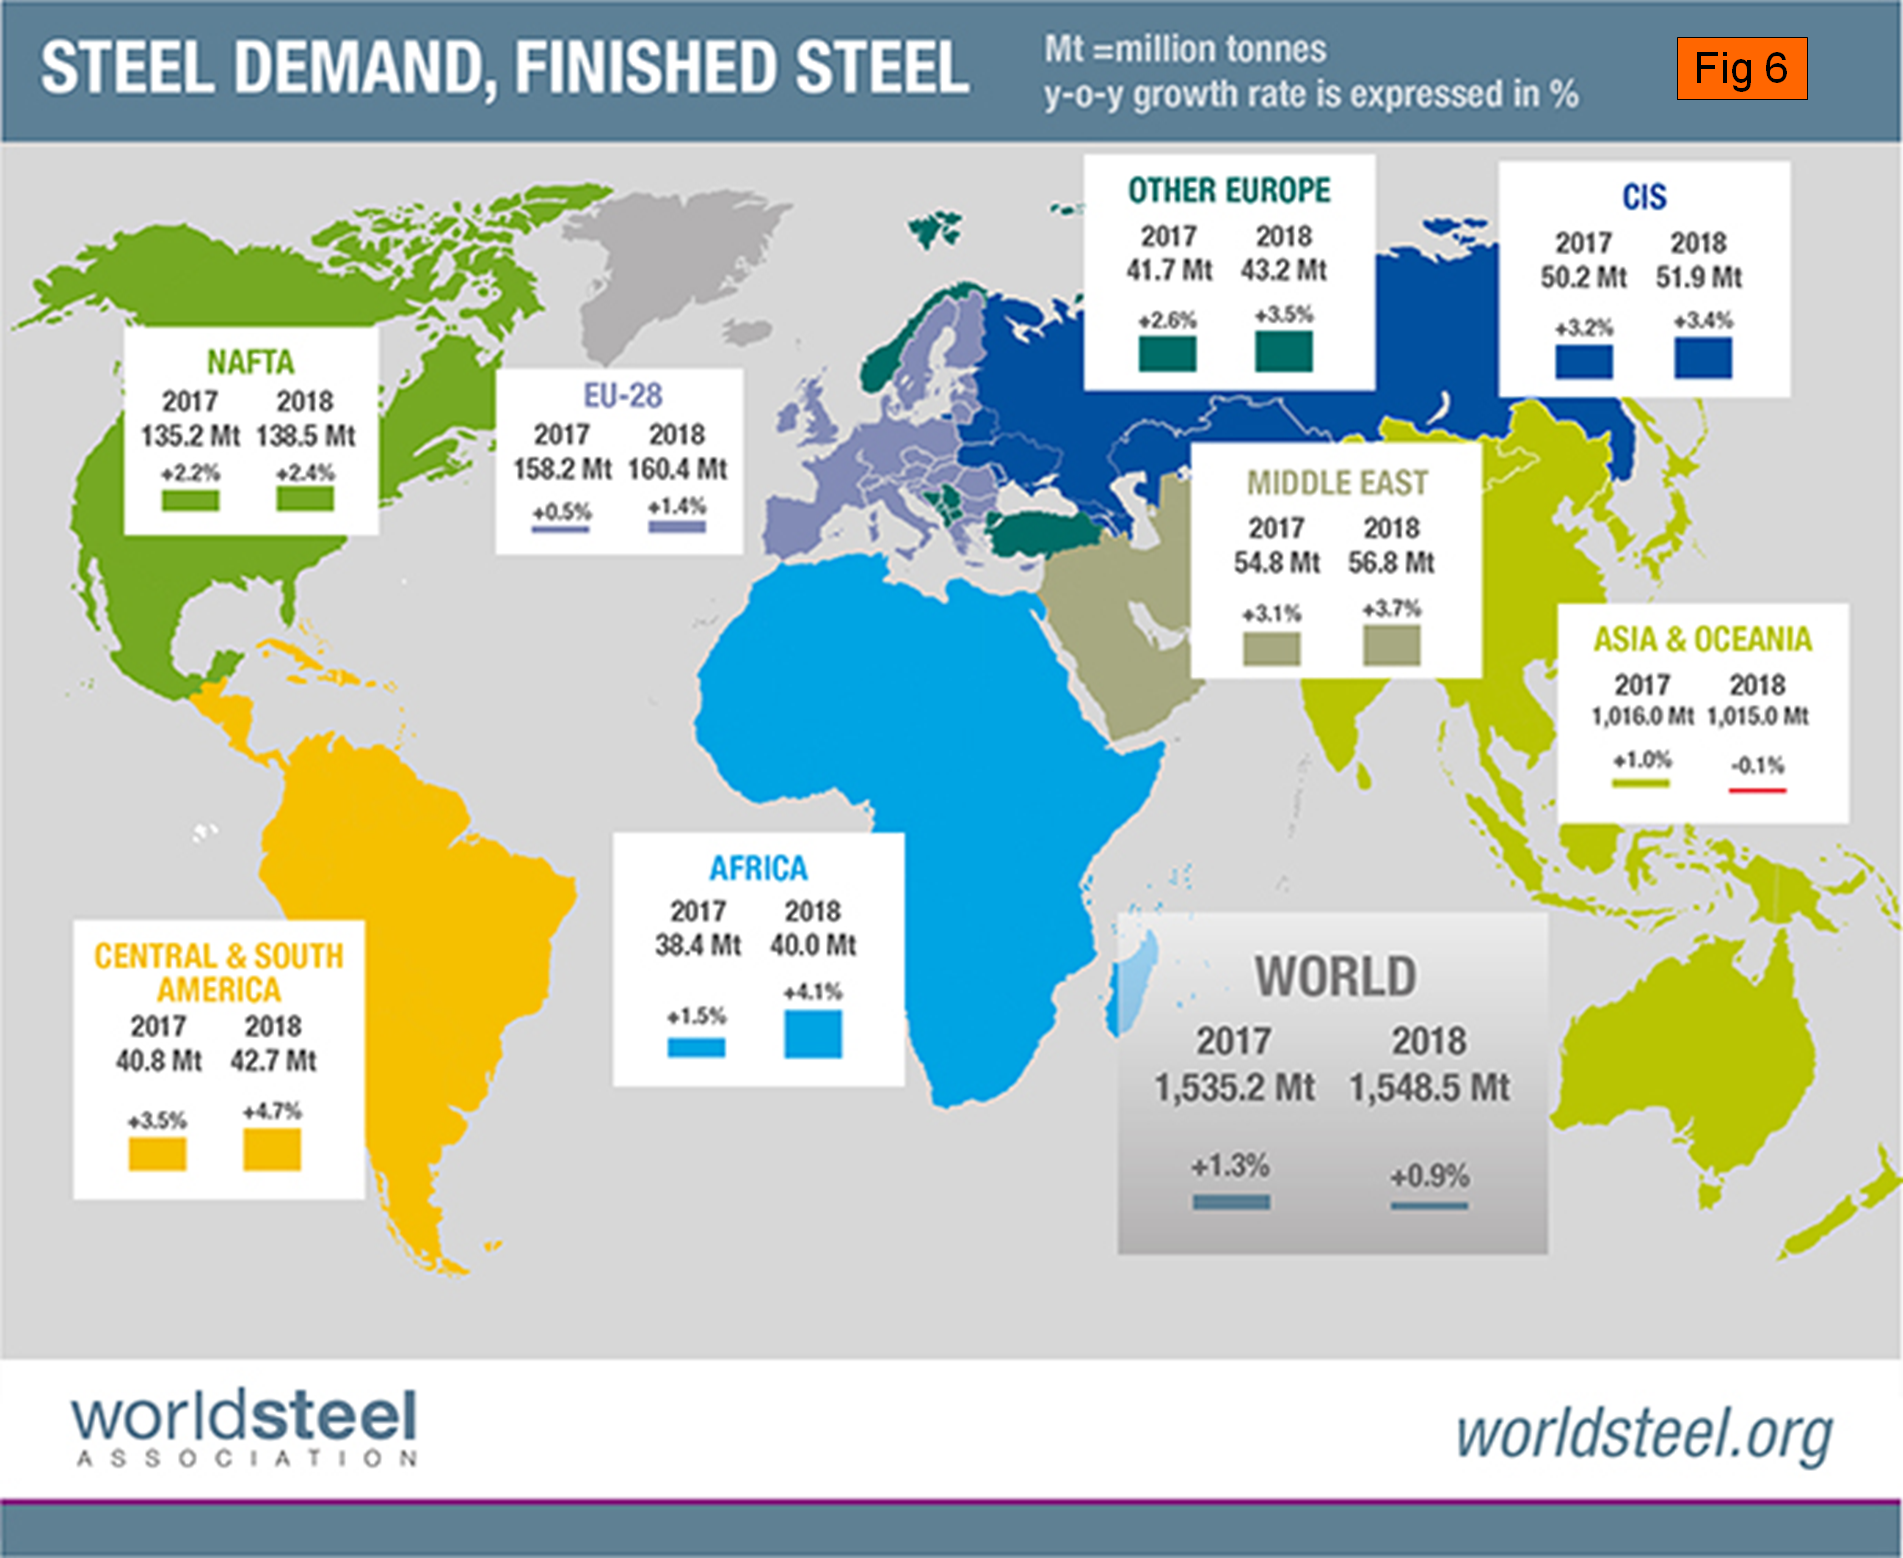
The April 2017 version of the World Steel Association Short Range Outlook (SRO) for apparent steel consumption forecast global growth of 1.3 percent in 2017 and 0.9 percent in 2018. The previous SRO through 2017 released last October had a growth rate of 0.5 percent in 2017, therefore the latest forecast is an upgrade. Figure 6 is reproduced from the WSA website and shows the forecast by region pictorially for 2017 and 2018. North American steel consumption is forecast to grow by 2.2 percent and 2.4 percent. Surprisingly, Asia is forecast to contract next year. Note this forecast is steel consumption, not crude steel production, which is the main thrust of what you are reading now.
SMU Comment: We think the comment we made last month bears repeating because of the implications for future global steel demand. On April 11 the IMF had this to say: “The infrastructure needs of emerging market economies, like China or India, differ from those of advanced economies like the United States or Germany. Many emerging economies must substantially expand their energy and transportation networks, or build them from scratch, to accommodate rapid economic growth. Our evidence from household surveys for 20 advanced and emerging market economies reveals a strong and positive relationship between personal income and transportation spending. Whereas people making $200 a year devote only 1 percent of their income to transportation needs, those making $20,000 a year spend 18 percent on transportation. Taking these factors into account, consumer spending on transportation is projected to quadruple by 2035 in India, China, and other parts of emerging Asia, as well as in sub-Saharan Africa. Merely building the paved roads and railroads needed to accommodate growing world demand for transportation could cost some $48 trillion over the next 20 years. Emerging market and developing economies will need the bulk of that investment.” This is why we at SMU find the Asia 2018 forecast from the WSA surprising, even unbelievable. A welcome report from the IMF in its April update of the World Economic Outlook raised the projected global growth rate for 2017 and 2018. Growth in the developing world is highly steel intensive, therefore this will take some pressure off the low global rate of capacity utilization.
Source: World Steel Association with analysis by SMU