Prices

July 24, 2017
No Slowdown in Chinese Steel Production
Written by Peter Wright
Global steel production in the three months through June set another record and once again China was the driver, reports the World Steel Association, with the following analysis by SMU.
World steel production in the month of June totaled 141,046,000 metric tons, down from 143,204,000 tons in May. Capacity utilization was 73.0 percent, up from 71.7 percent May. The three-month moving averages, (3MMA) that we prefer to use were 142,155,000 and 72.8 percent, respectively. How can production can go down and capacity utilization go up? WSA says it’s driven by tons/day, which increased in June because there was one less day. Capacity is 2.33 billion metric tons per year. Figure 1 shows monthly production and capacity utilization since January 2000.
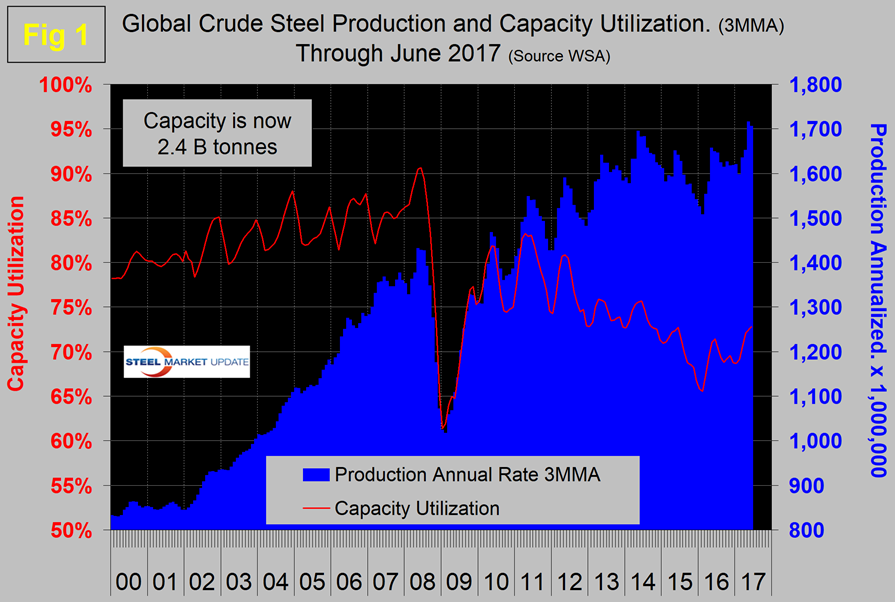
On a tons per day basis, production in June was 4.702 million metric tons with a 3MMA of 4.687, thus exceeding May’s all-time high of 4.664 million metric tons. In three months through June, production increased by 3.4 percent year over year. On a 3MMA basis, capacity utilization had an erratically downward trajectory from mid-2011 through early 2016 when it bottomed out at 65.5 percent in February. A turnaround seems to be developing as the June capacity utilization was the highest since September 2014. On Oct. 9, the OECD’s steel committee estimated that global capacity would increase by almost 58 million metric tons per year between 2016 and 2018 bringing the total to 2.43 billion metric tons.
As we dig deeper into what is going on, we start with seasonality. Global production has peaked in early summer for the last seven years, with April and June on average having the highest volume. Figure 2 shows the average tons/day production for each month since 2008.
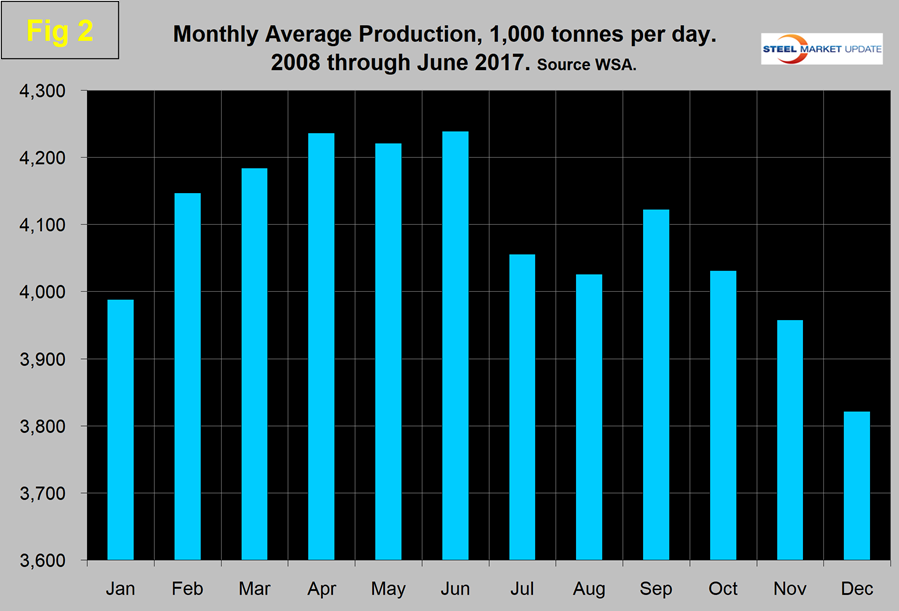
In those 10 years on average, June has been up by 0.42 percent; this year June was up by 1.78 percent. Figure 3 shows the monthly year-over-year growth rate on a 3MMA basis since January 2005.
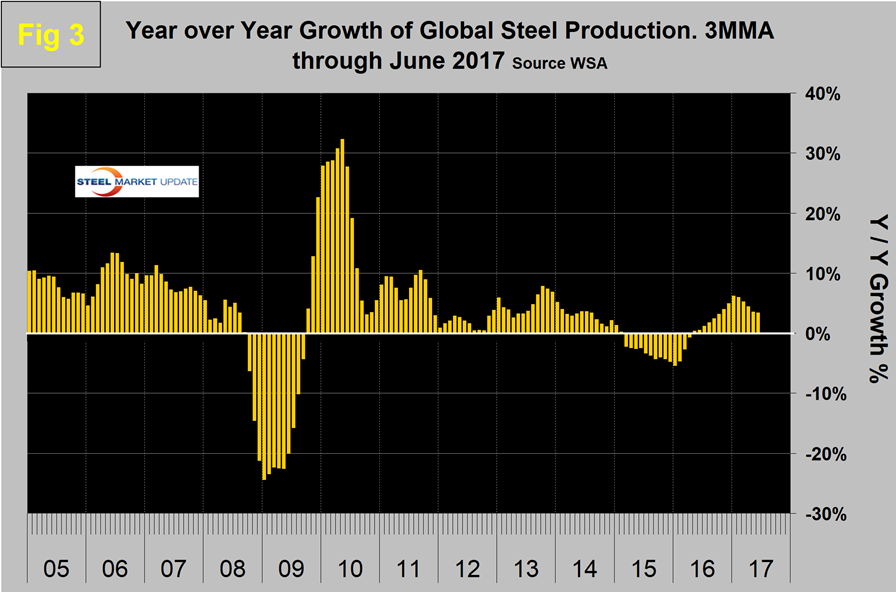
Production began to contract in March 2015 and the contraction accelerated through January 2016 when it reached negative 5.6 percent. Growth improved every month through January this year when it reached positive 6.2 percent. Growth slowed to 5.3 percent in March, 3.5 percent in May and 3.4 percent in June. In the six months through May, China’s growth rate was lower than the rest of the world. That changed in June when China expanded by 4.1 percent and the world as a whole grew by 3.4 percent. The comparison gets even worse when we see that the world excluding China expanded by only 2.7 percent.
Table 1 shows global production broken down into regions and the production of the top 10 nations in the single month of June, along with their share of the global total. It also shows the latest three months and 12 months production through June with year-over-year growth rates for each period. Regions are shown in white font and individual nations in beige.
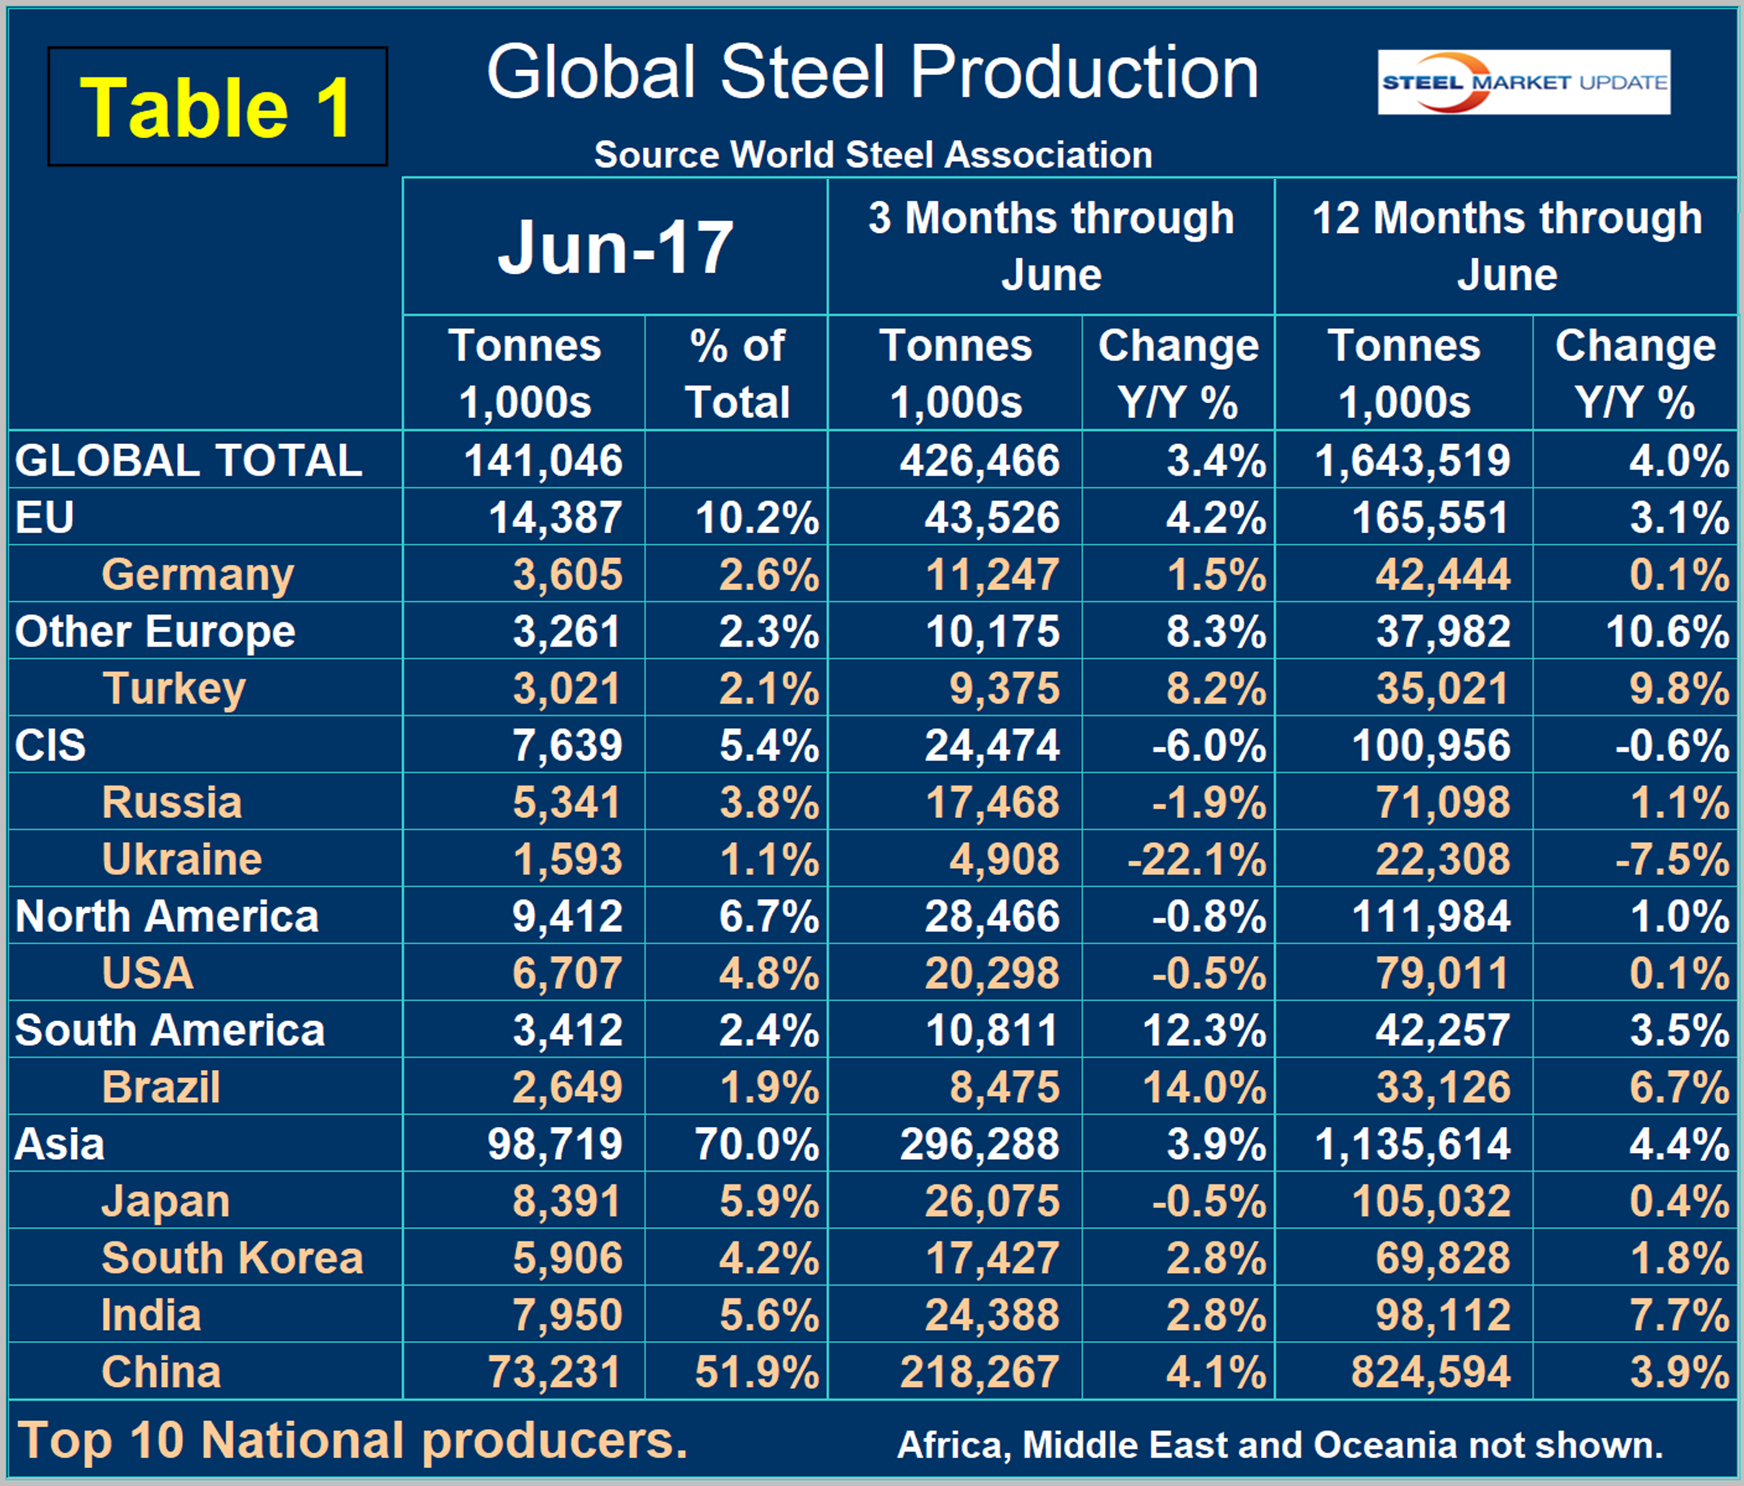
The world as a whole had positive growth of 3.4 percent in three months and 4.0 percent in 12 months through June. If the three-month growth rate exceeds the 12-month rate, we interpret this to be a sign of positive momentum, which was the case for the 16 months through May. In June, momentum for the world as a whole became negative, but for China it was positive. China’s share of global production was 51.9 percent in June. Vietnam doesn’t appear in Table 1 and wasn’t even recognized as a producer by the World Steel Association until January last year. Vietnam has seen its production grow from 407,000 tons in January last year to 888,000 tons in March this year. This may be another piece of the puzzle that describes the re-processing and export of Chinese hot rolled coil. In Q1 this year, Vietnam imported HRC at an annual rate of 11 million tons, which was by far the highest of all importing nations, nearly all from China.
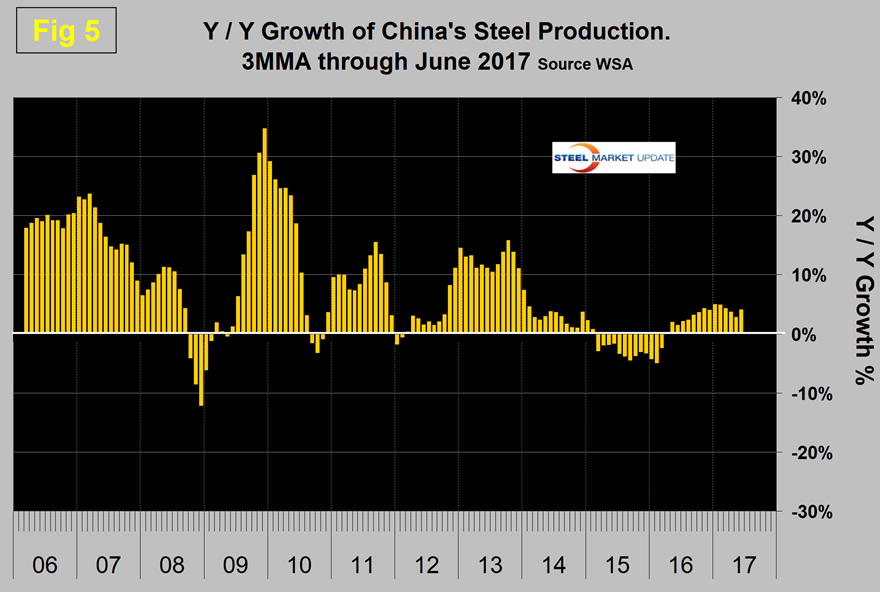
Figure 4 shows China’s production since 2005 and Figure 5 shows the year-over-year growth. China’s production, after slowing for 13 straight months, returned to positive growth each month in May 2016 through June this year on a 3MMA basis.
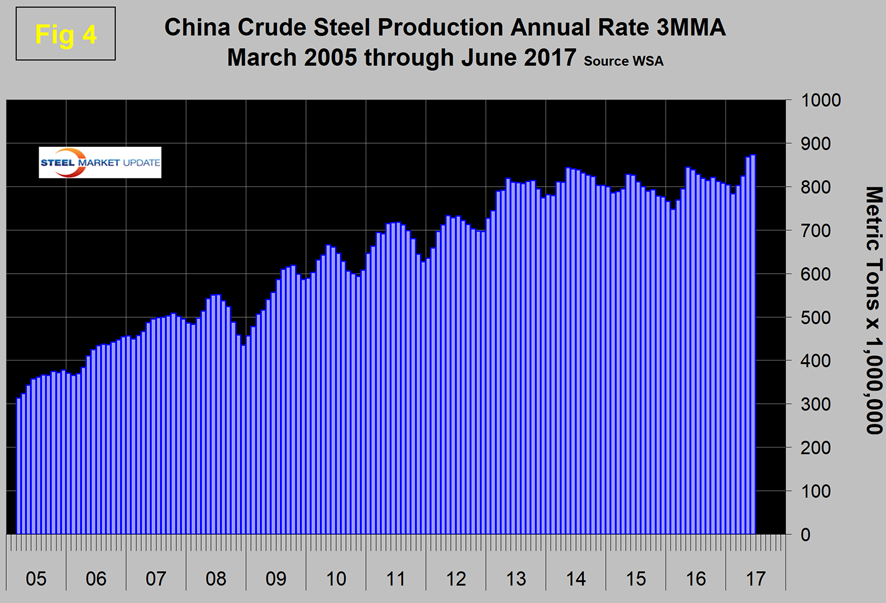
It may look from Figure 4 as though China’s production was falling through February, but on a year/year basis this was not the case. Therefore, the slowdown in Chinese steel production that they have been promising is not happening.
Table 1 shows that in 3 months through June year/year, every region except the CIS and North America had positive growth. North America was down by 0.8 percent. Within North America, the U.S. was down by 0.5 percent, Canada was down by 7.6 percent and Mexico was up by 3.2 percent. In the first half of 2017, Mexico produced 54.8 percent more steel than Canada. South America, led by Brazil, has the highest growth rate in three months through June followed by other Europe led by Turkey. Asia as a whole was up 3.9 percent.
In previous monthly updates, we have included the April 2017 version of the World Steel Association Short Range Outlook (SRO) for apparent steel consumption in 2017 and 2018. We will continue to include this as Figure 6 until the next update is released in October.
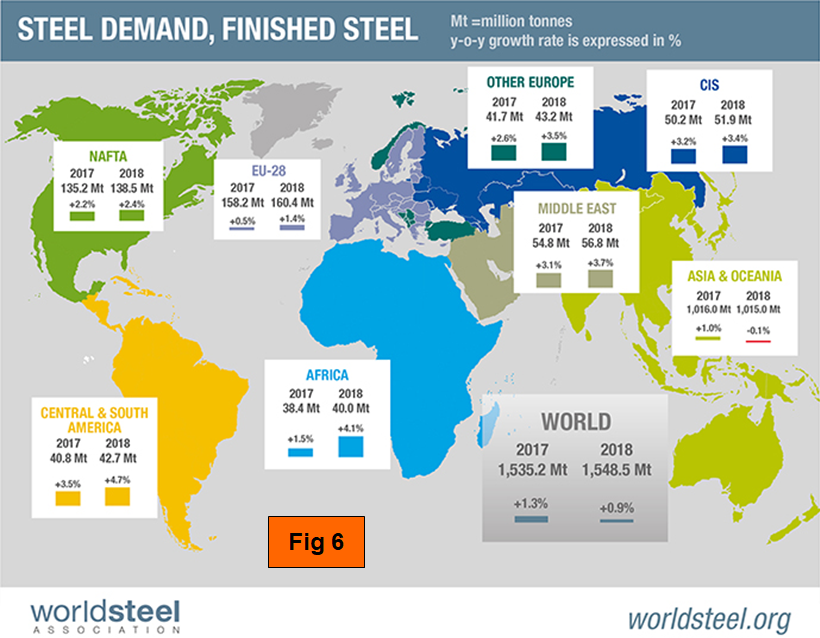
The April forecast was for global growth of 1.3 percent and 0.9 percent in 2017 and 2018, respectively. North American steel consumption is forecast to grow by 2.2 percent and 2.4 percent. Surprisingly, Asia is forecast to contract next year. Note this forecast is steel consumption, not crude steel production, which is the main thrust of what you are reading now.
SMU Comment: Spending on transportation infrastructure is projected by the IMF to quadruple by 2035 in India, China, and other parts of emerging Asia, as well as in sub-Saharan Africa. This investment is highly steel intensive, therefore there is a light at the end of the tunnel as far as steelmaking overcapacity is concerned, but it’s a long tunnel. Prior to this June data it looked as though pressure from China might be abating, but based on one month’s result, that situation may be reversing.