

Market Data

September 29, 2017
Key Market Indicators Trending Up for Steel
Written by Peter Wright
Steel market indicators look good in the September data. Our view of the present situation is that 50 percent of the 36 indicators are historically positive with only 19 percent negative. The balance of them are within the band of historically normal. This was the same result as May and August. Along with September, these three months were the best since our analysis began in January 2010. The trends are still good with 72 percent of the indicators heading in a positive direction, though down from 83 percent in March. In the last eight months, the indicator group as a whole has been trending better than at any time since we began this analysis. Trends lead the present situation by about four months.
![]() See the end of this article for an explanation of the Key Indicators concept. It explains the difference between our view of the present situation, which is subjective, and our analysis of trends, which is based on the latest facts available. The total number of indicators considered in this analysis is 36.
See the end of this article for an explanation of the Key Indicators concept. It explains the difference between our view of the present situation, which is subjective, and our analysis of trends, which is based on the latest facts available. The total number of indicators considered in this analysis is 36.
Please refer to Table 1 for our view of the present situation and the quantitative measure of trends. Readers should regard the color codes in the present situation column as a visual summary of the current market condition. The “Trend” columns of Table 1 are also color coded to give a quick visual appreciation of the direction in which the market is headed. All data included in this table was released in September. The month or specific date to which the data refers is shown in the second column from the far right. All data is the latest available as of Sept. 30, 2017.
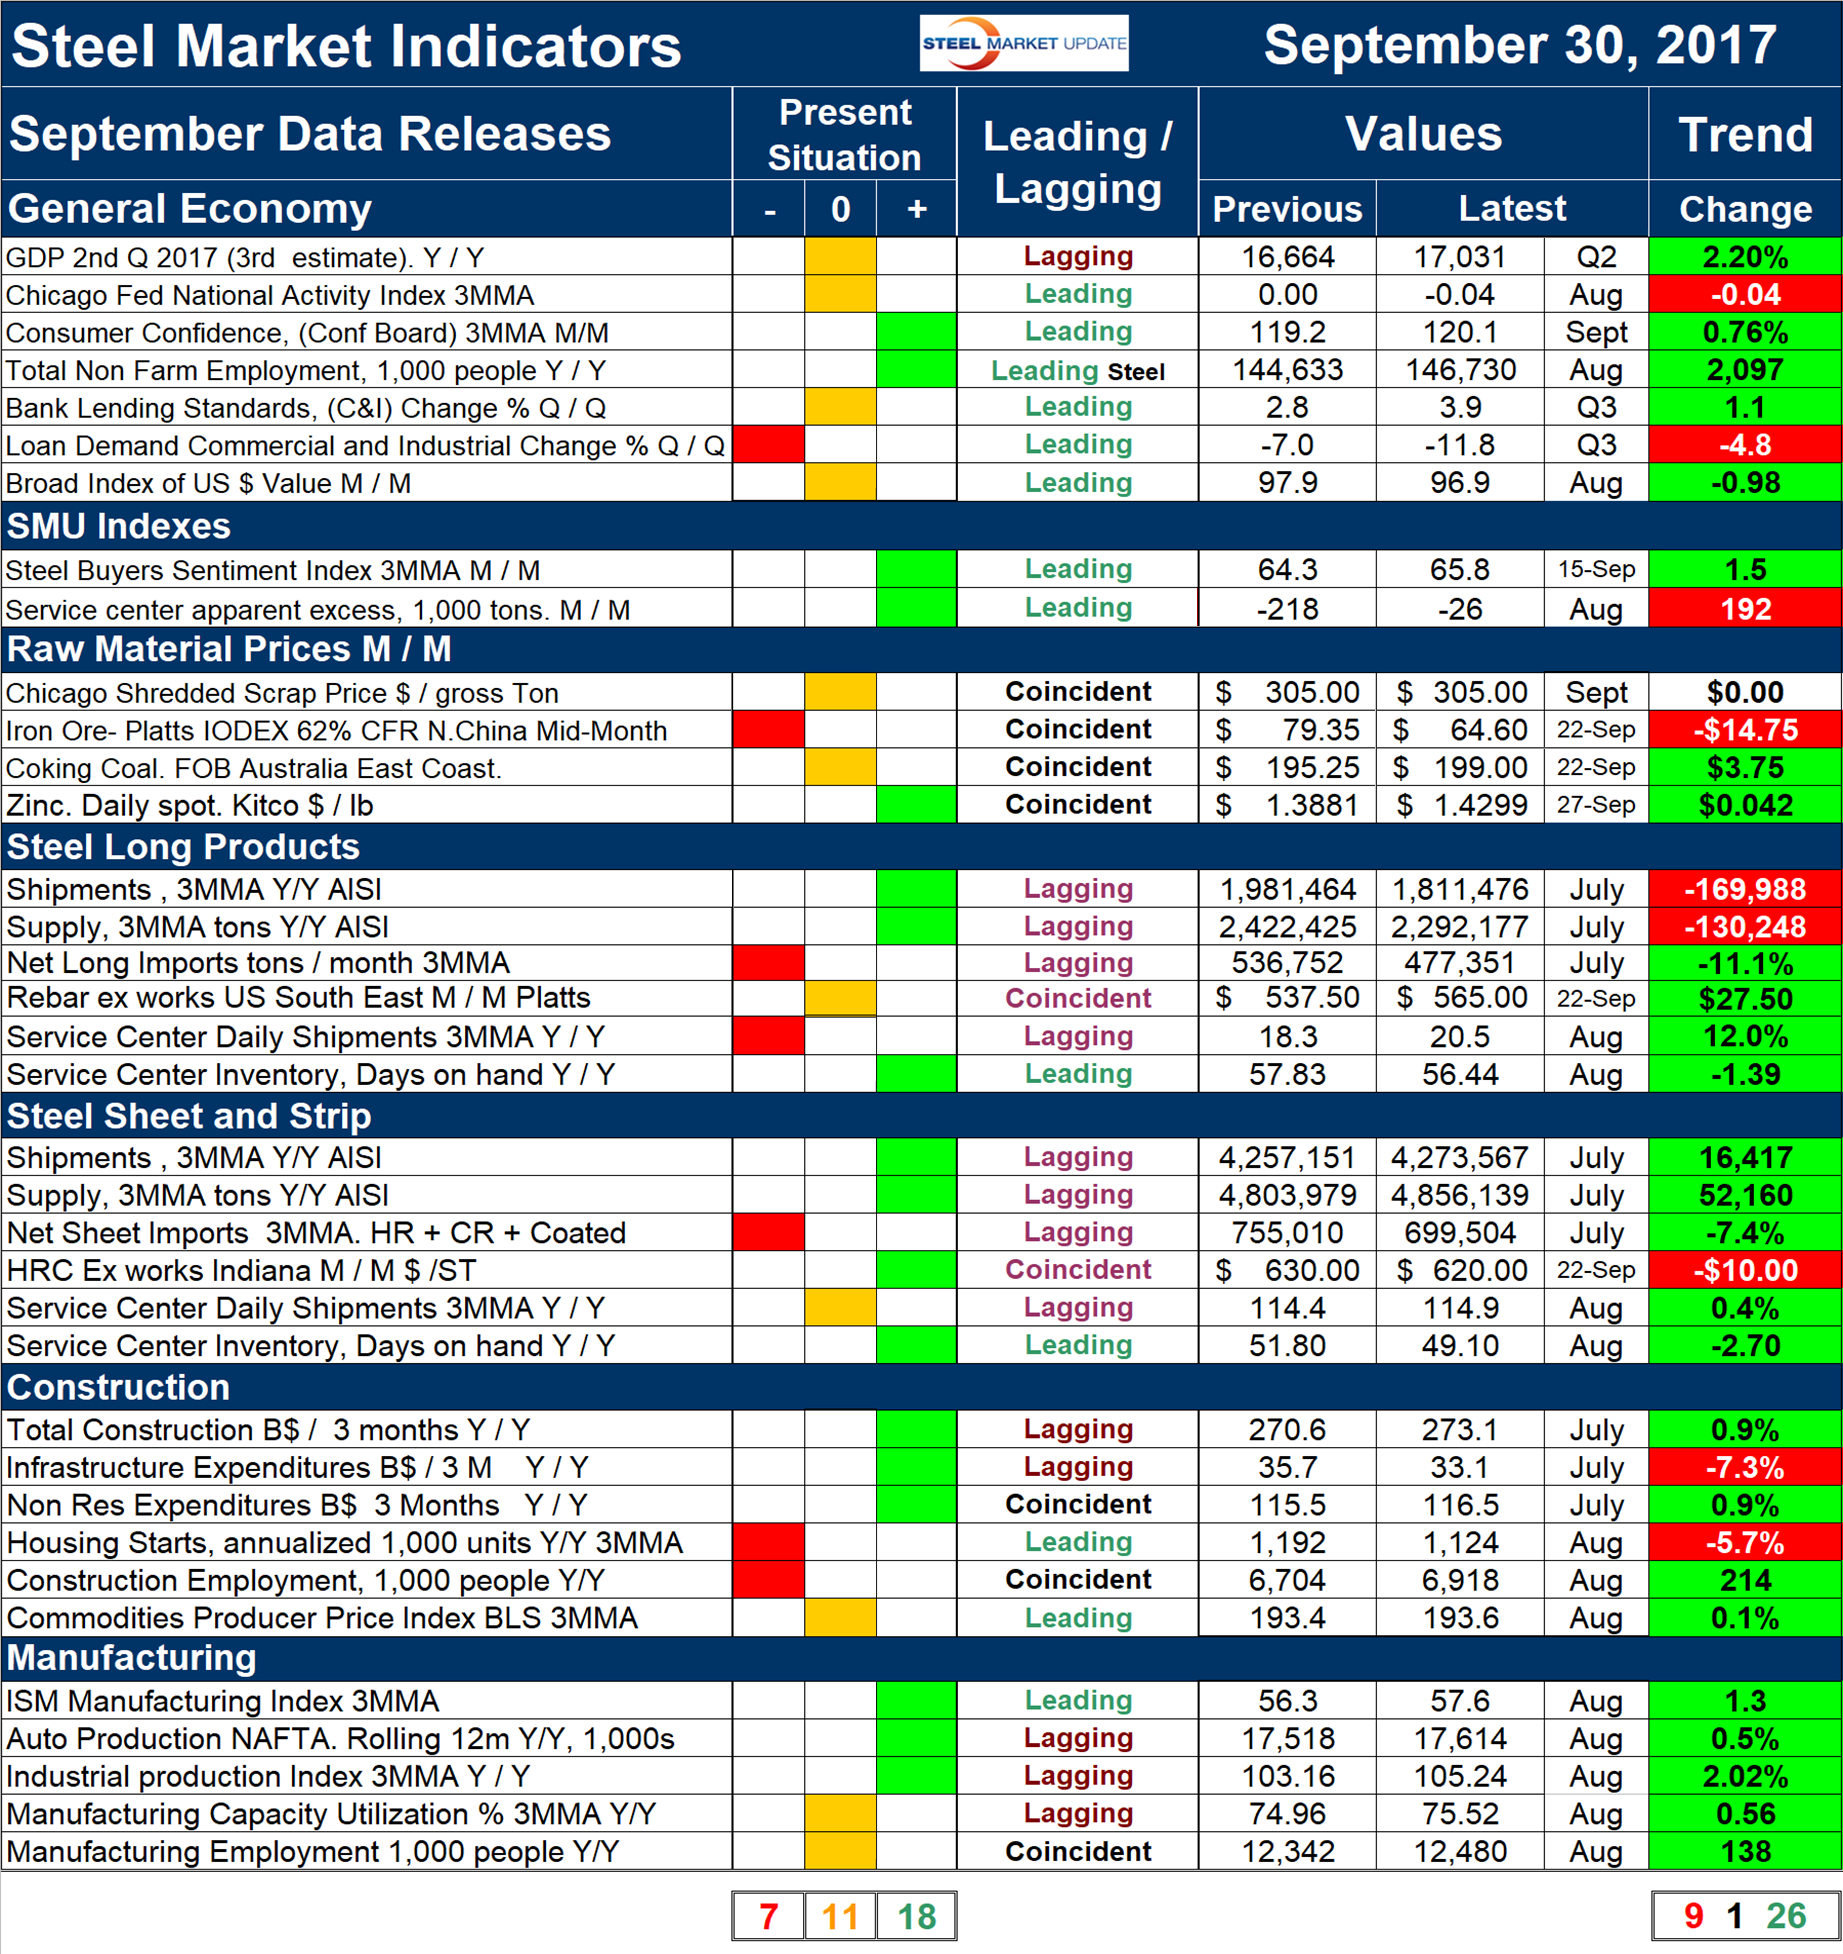
Present Situation
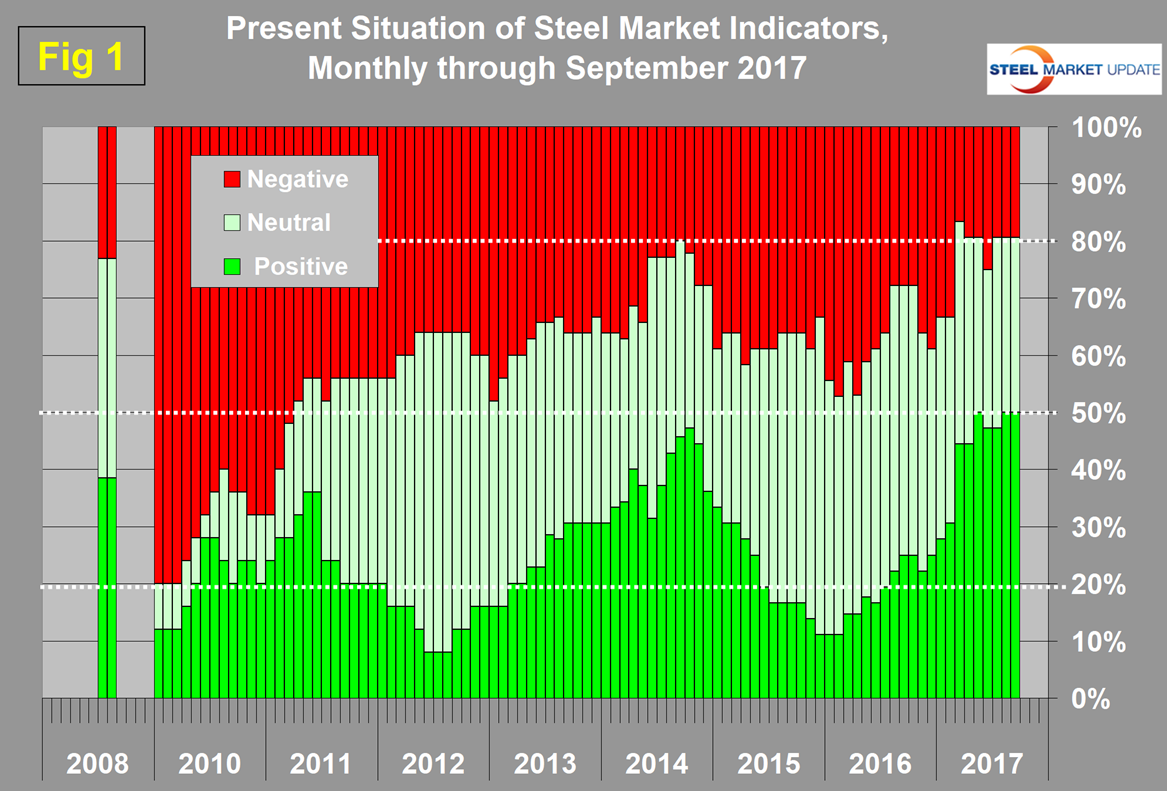
There was no net change in the number of indicators that we consider to be positive in September; neither was there any change in the individual indicators. We currently view 18 of the 36 indicators as positive, 11 as neutral and 7 as negative. Our intent in using the word neutral is to say that this indicator is in the mid-range of historical data. Figure 1 shows our monthly assessment of the present situation since January 2010 on a percentage basis. The number of indicators classified as positive peaked at 47.2 percent in October 2014 and steadily declined to 11.1 percent in the three months through January 2016. Beginning in February 2016, there was a steady increase in the number of indicators that we consider to be positive through May 2017, when a new high of 50.0 percent was reached. June and July declined to 47.2 percent positive with a return to 50 percent in August and September. The combination of positive and neutral indicators at the end of March was the highest ever at 83.3 percent. April, May, July, August and September were all 80.6 percent by this measure.
Trends
Most values in the trends columns are three-month moving averages (3MMA) to smooth out what can be very erratic monthly data. Trend changes in the individual sectors since the end of August data are described below, together with some general comments. (Please note in most cases this is not September data, but data that was released in September for previous months.)
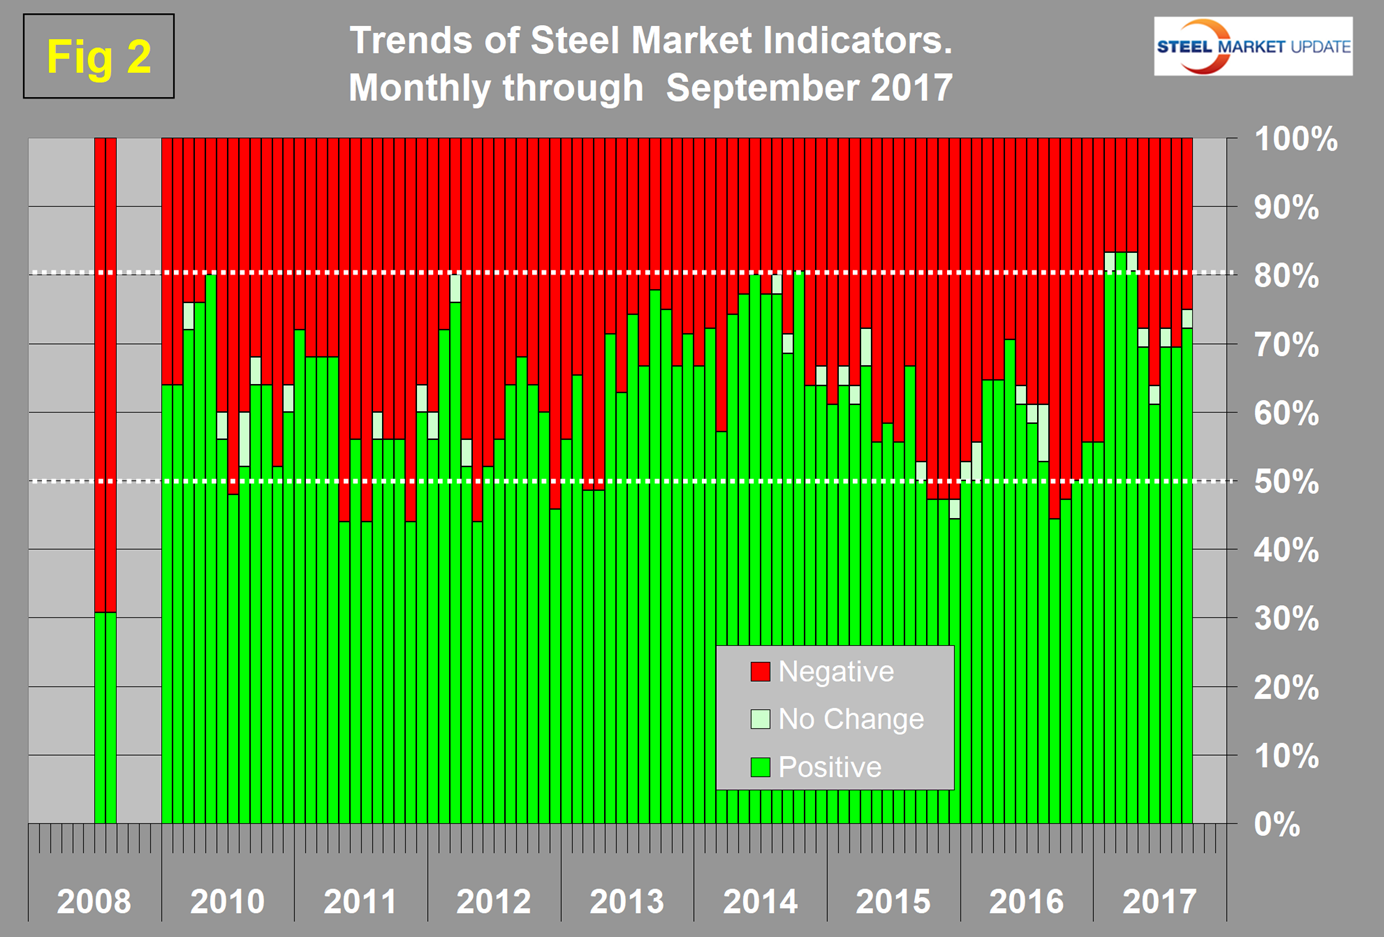
In the four months October through January, there was a steady improvement in trends. There was a positive surge in February that was sustained in March and April, followed by a significant decline in both May and June and a partial recovery in July, August and September. Figure 2 shows the trend of the trends and the pre-recession situation at the far left of the chart. The proportion of indicators trending positive in both the July and August data was 69.4 percent, increasing to 72.2 percent in September. March 2017, at 83.3 percent, was the best result since our data was first compiled.
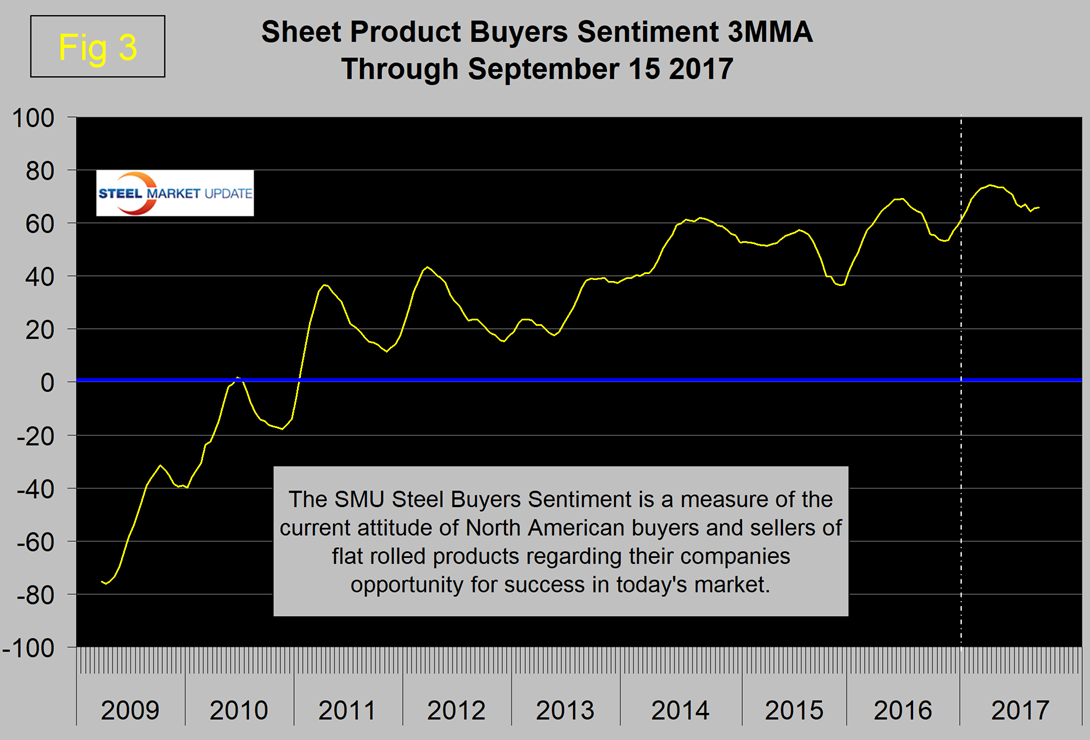
Our observations about trends in the September data are as follows: On Thursday, the third estimate of GDP in the second quarter was released and improved from 2.6 percent in the first estimate to 3.06 percent. This is an annualized change from the first quarter. Our key indicators chart records year-over-year changes and by this measure in Q2 the economy grew by 2.20 percent. In the General Economy section of Table 1 there were no trend reversals. Five of the seven indicators are trending positive. There was one change in the direction of the trends of the SMU proprietary indexes. The steel buyers’ sentiment reversed direction and trended positive with an increase from 64.33 (3MMA) in mid-August to 65.83 in mid-September, and is still historically very strong (Figure 3).
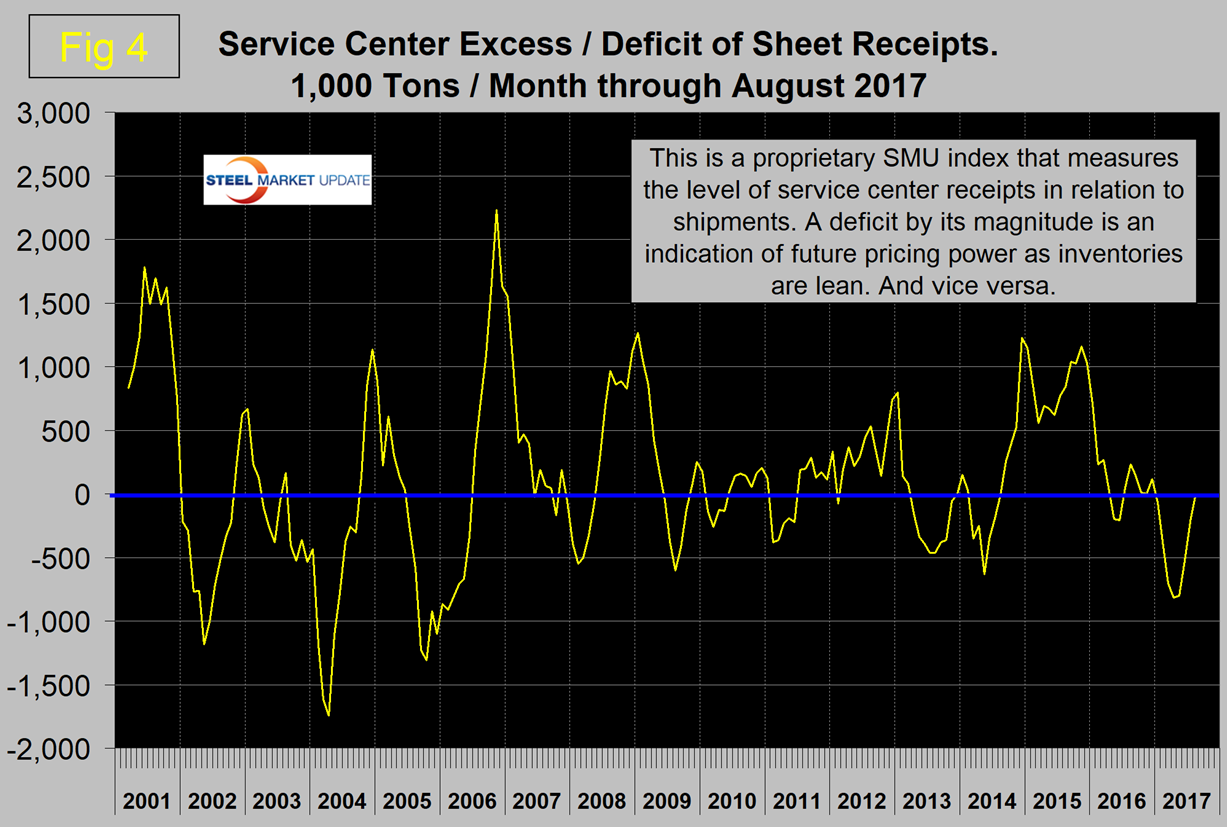
Service center excess of sheet products became negative in January, and grew increasingly so through April when it reached negative 816,000 tons. Since then, the deficit has declined to a mere 26,000 tons. This is a proprietary SMU calculation. We regard an inventory deficit to be positive in terms of pricing power, therefore we are presently in a situation of negotiation neutrality (Figure 4).
In the raw materials section, the prices of all four ingredients were trending positive in August, but in September the price of Chicago shredded remained unchanged and the price of iron ore declined. We regard rising raw materials prices as positive and indicative of a strengthening market. In the long steel products sector, there was one trend reversal when net imports declined, albeit from a very high level. The trends for sheet products improved in the September data when five of the six indicators trended positive, an improvement from three positives in the August data. Shipments, net imports and service center daily shipments all reversed direction and improved. The price of HRC ex works Indiana took a step back and declined by $10 per net ton. In the construction sector, there was one reversal when housing starts declined in August. There were no other trend changes in construction or manufacturing. In the manufacturing sector, all five indicators are trending positive.
We believe a continued examination of both the present situation and direction is a valuable tool for corporate business planning.
Explanation: The point of this analysis is to give both a quick visual appreciation of the market situation and a detailed description for those who want to dig deeper. It describes where we are now and the direction the market is headed, and is designed to describe the situation on a specific date. The chart is stacked vertically to separate the primary indicators of the general economy, of proprietary Steel Market Update indices, of raw material prices, of both sheet and long product market indicators, and finally of construction and manufacturing indicators. The indicators are classified as leading, coincident or lagging as shown in the third column.
Columns in the chart are designed to differentiate between where the market is today and the direction it is headed. Our evaluation of the present situation is subjectively based on our opinion of the historical value of each indicator. There is nothing subjective about the trends section, which provides the latest facts available on the date of publication. It is quite possible for the present situation to be predominantly red and trends to be predominantly green, or vice versa, depending on the overall situation and direction of the market. The present situation is subdivided into, below the historical norm (-), (OK), and above the historical norm (+). The “Values” section of the chart is a quantitative definition of the market’s direction. In most cases, values are three-month moving averages to eliminate noise. In cases where seasonality is an issue, the evaluation of market direction is made on a year-over-year comparison to eliminate this effect. Where seasonality is not an issue, concurrent periods are compared. The date of the latest data is identified in the third values column. Values will always be current as of the date of publication. Finally, the far-right column quantifies the trend as a percentage or numerical change with color code classification to indicate positive or negative direction.


