

Market Data
November 13, 2017
SIMA Data Shows Rolled, Sheet Imports Slowing
Written by Tim Triplett
Total rolled steel imports declined by 14.0 percent in the three months through October, compared to the three months through July. Sheet products were down by 12.6 percent on the same basis, based on final license data for October reported by of the U.S. Commerce Department on Nov. 7.
The data is reported within the Steel Import Monitoring and Analysis system (SIMA). An explanation of the methodology that we use to analyze the trade data is given at the end of this piece, together with notes describing SIMA. All volumes in this analysis are reported in short tons. We prefer not to dwell on single-month results because of the extreme variability that can occur in individual products. In the comments below, we use three-month moving averages to give what we believe is the most accurate picture.
The three-month moving average (3MMA) of rolled product import volume in July was the highest since May 2015. August, September and October progressively declined. The 3MMA in October was 2,341,411 tons, down from 2,498,066 in September, 2,666,799 in August and 2,722,567 in July.
Figure 1 shows the 3MMA through October licensed tons of semi-finished, flat and long products since January 2004. Imports of semi-finished in October had a 3MMA of 706,270 tons, which was up by 20.7 percent year over year. “Flat” includes all hot and cold rolled sheet and strip, plus all coated sheet products, plus both discrete and coiled plate. The 3MMA of flat rolled imports was 1,107,548 tons in October, which was down by 4.8 percent year over year. Long product imports were range bound between 519,000 tons and 772,000 tons for 34 months between October 2014 and August 2017 with no trend evident. In September 2017, long product imports broke out of the range to the downside with a volume of 508,564 tons and stayed down in October at 467,740 tons. Year over year, longs were down by 20.5 percent.
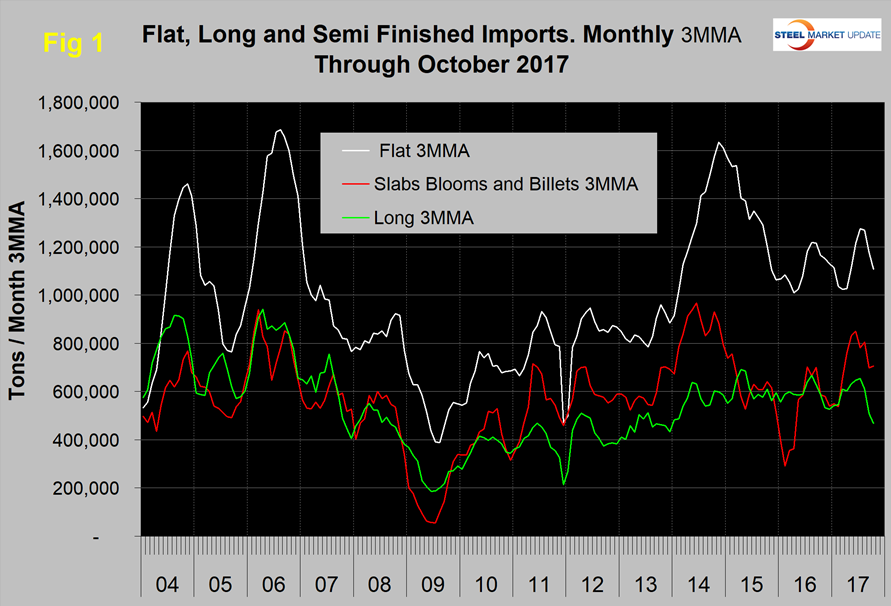
Figure 2 shows the trend of sheet and strip product imports since January 2004. The total of these products was down by 12.6 percent in three months through October compared to three months through July, and down by 3.4 percent year over year. The four major product groups all declined in the latest data, with electrogalvanized and tin plate increasing slightly.
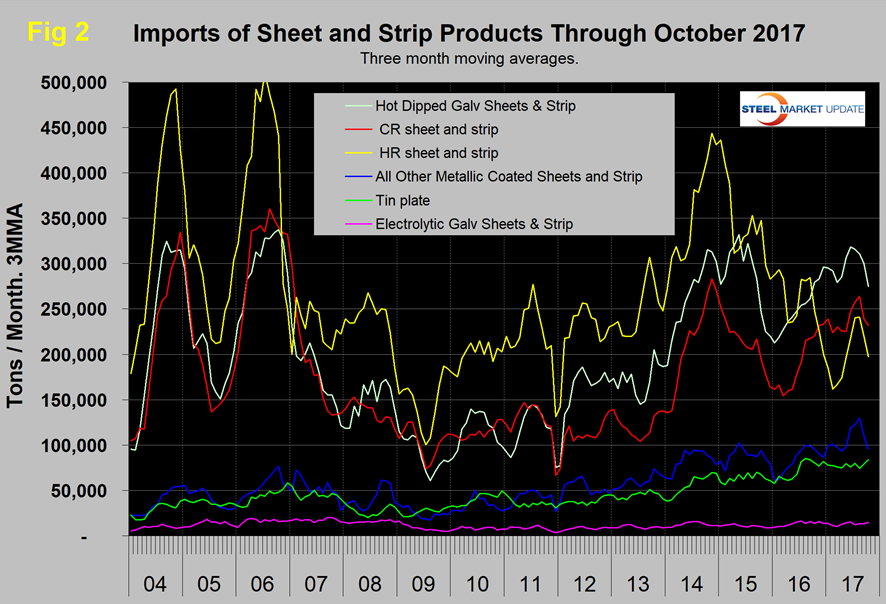
Table 1 provides an analysis of major product groups and of sheet products in detail. It compares the average monthly tonnage in the three months through October 2017 with both the three months through July (3M/3M) and the three months through October 2016 (Y/Y). All sheet products except electrogalvanized and tin plate were down in the three-month comparison. On a year over year comparison, hot rolled was down by 20.3 percent. Cold rolled was up by 5.1 percent. Plate was down by 11.4 percent, but tubulars were up by 109.1 percent.
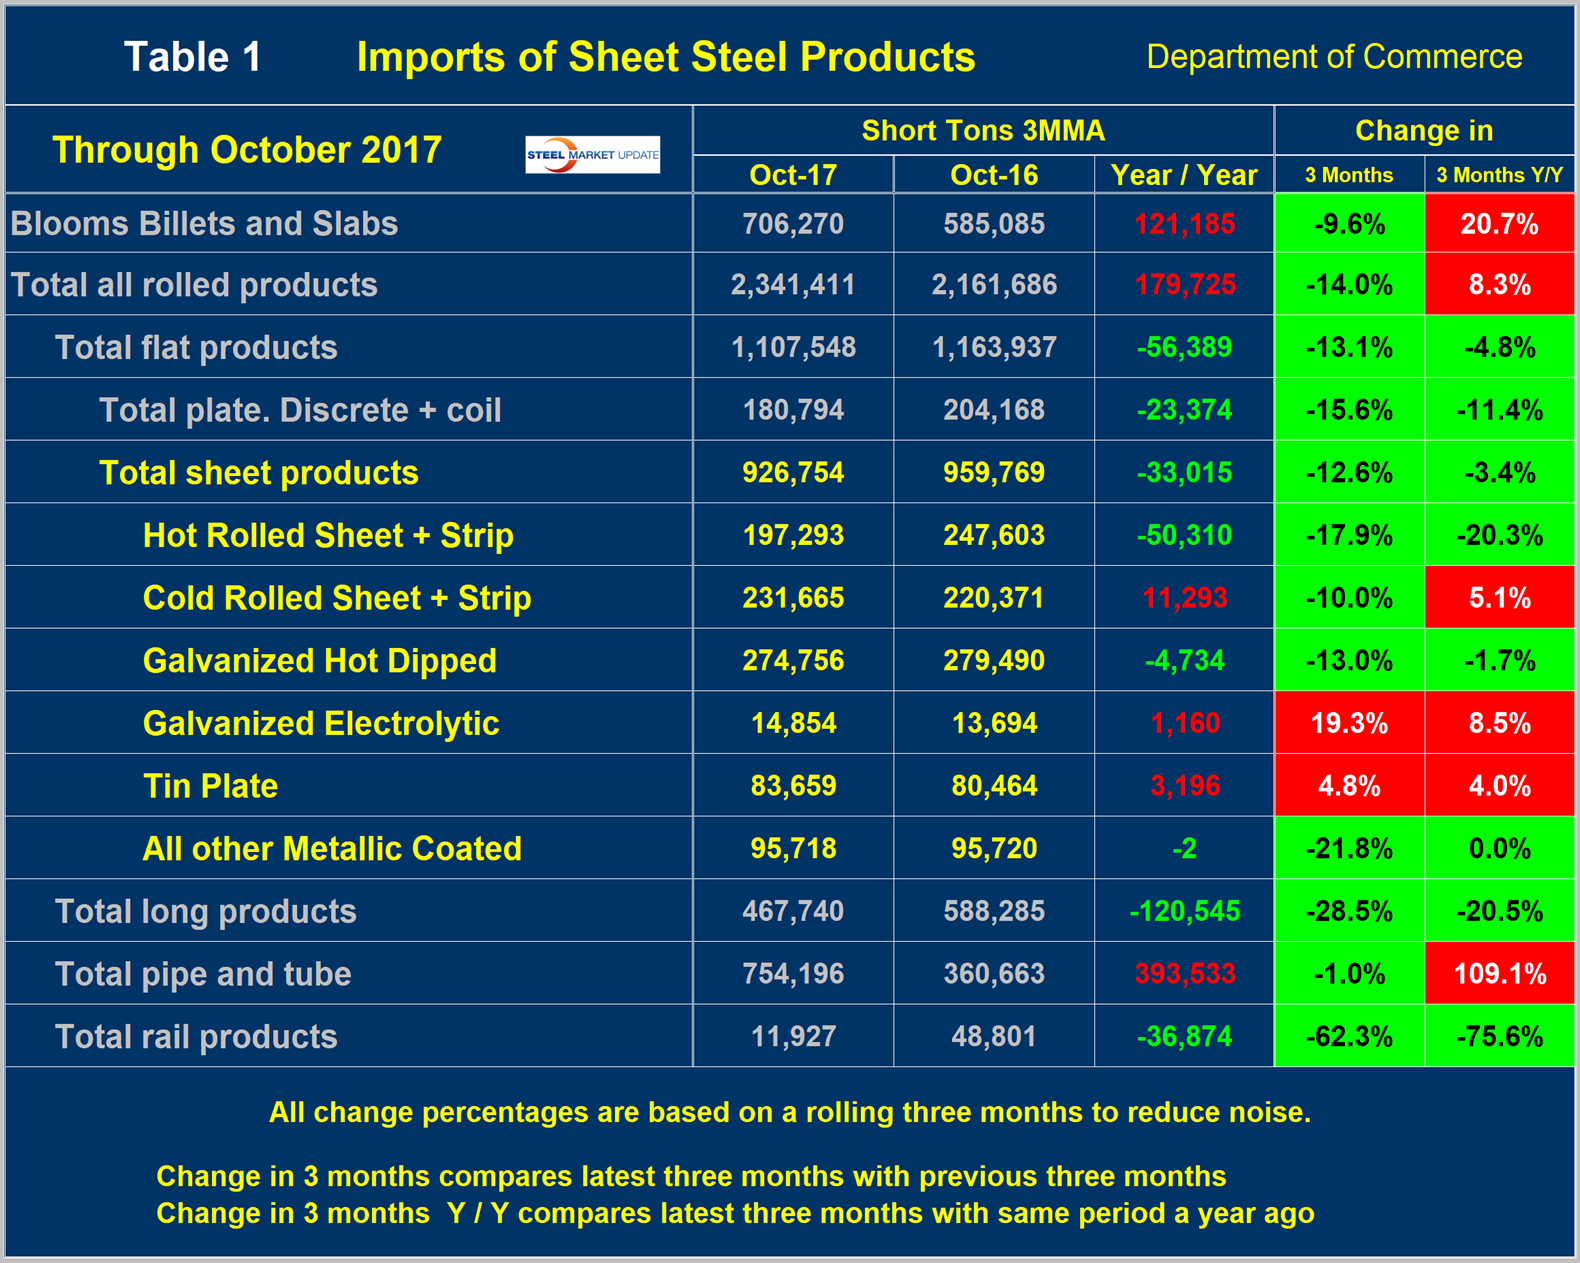
Table 2 shows the same analysis for long products. The total tonnage of long products was down by 120,545 tons per month year over year, entirely driven by a decline in rebar and wire rod volumes. On a 3M/3M basis, the total volume of long products declined by 28.5 percent.
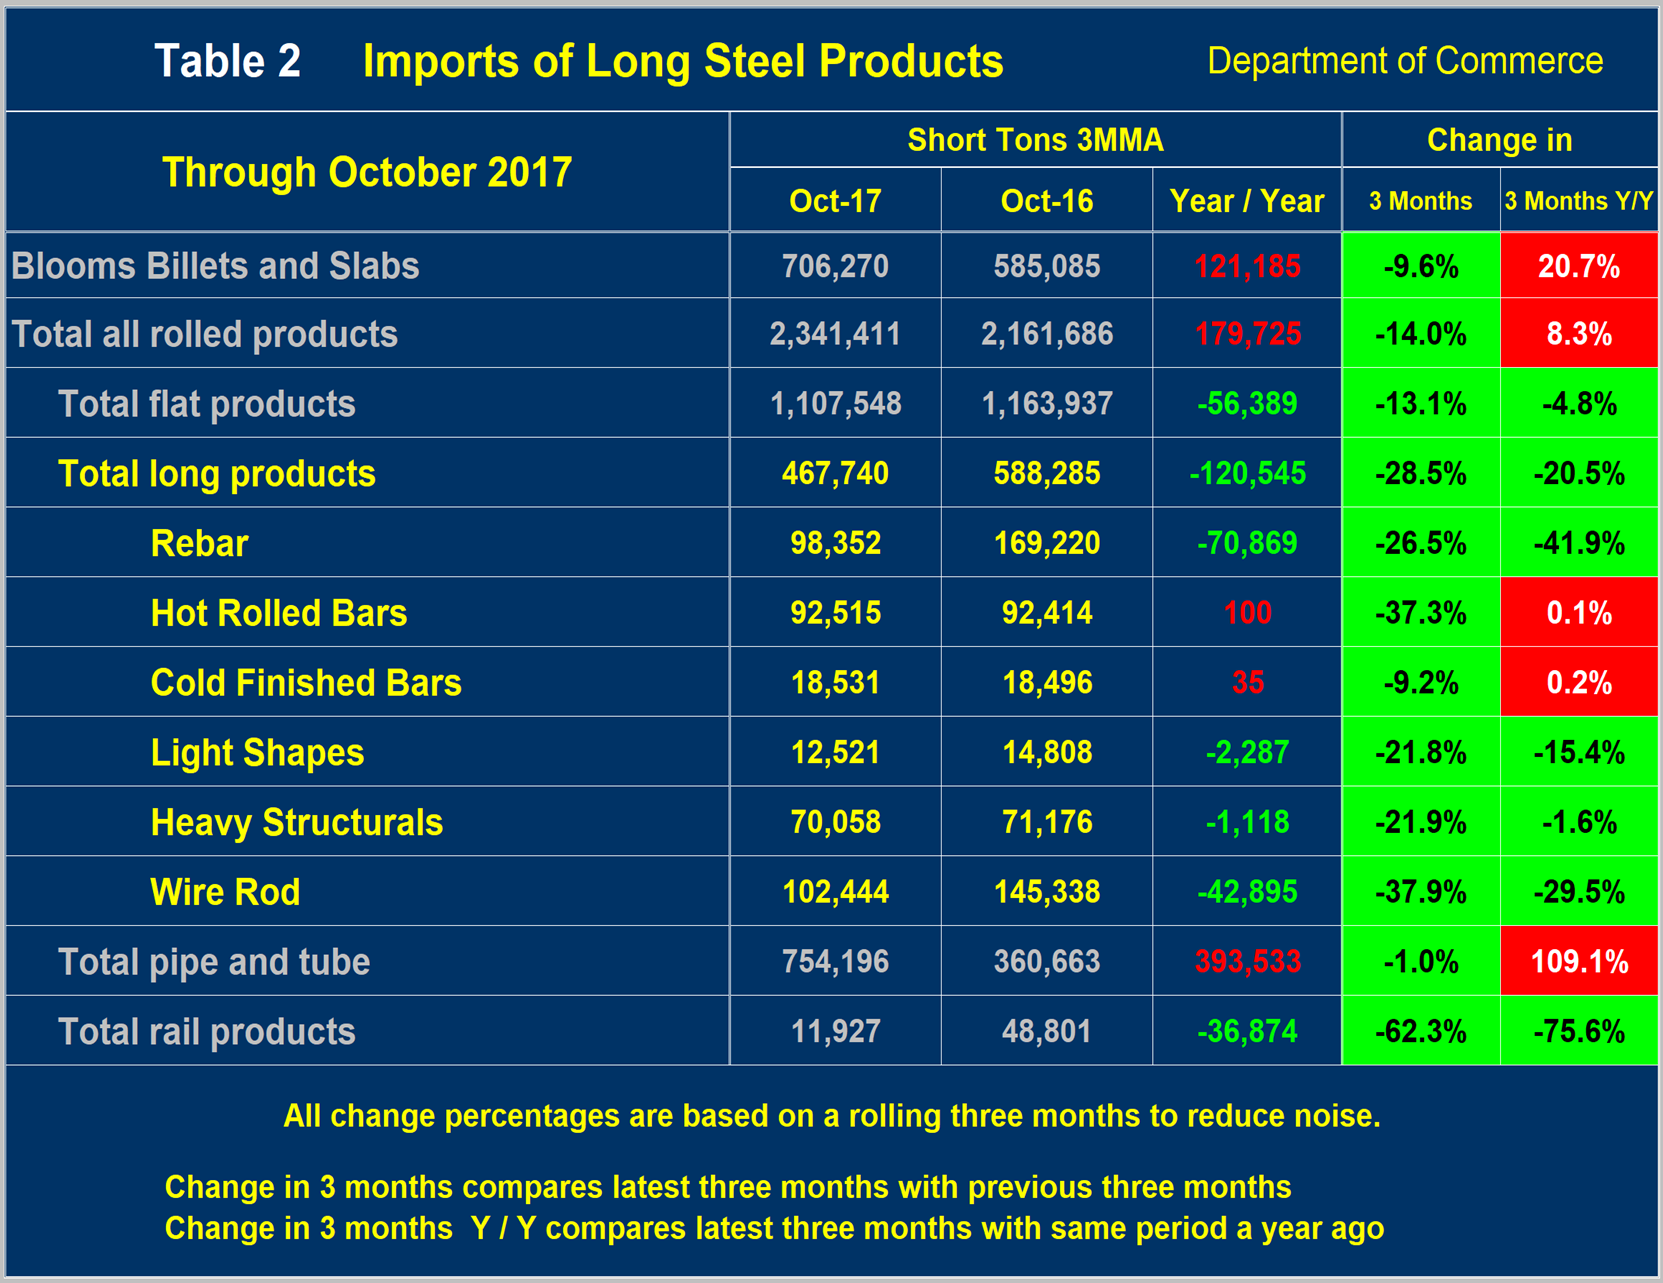
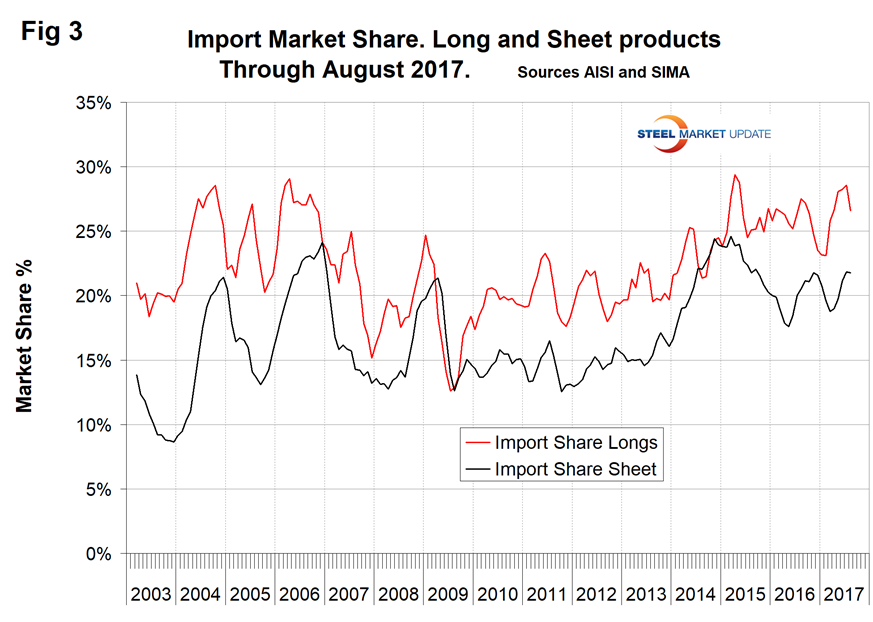
Figure 3 shows the import market share of sheet and long products through August, which is the latest data available. The import market share of sheet products peaked at 24.3 percent in March 2015. The August 2017 level was 21.8 percent, the same as July. Long product import market share has been considerably higher than for sheet products since early 2015 and in August was 26.6 percent.
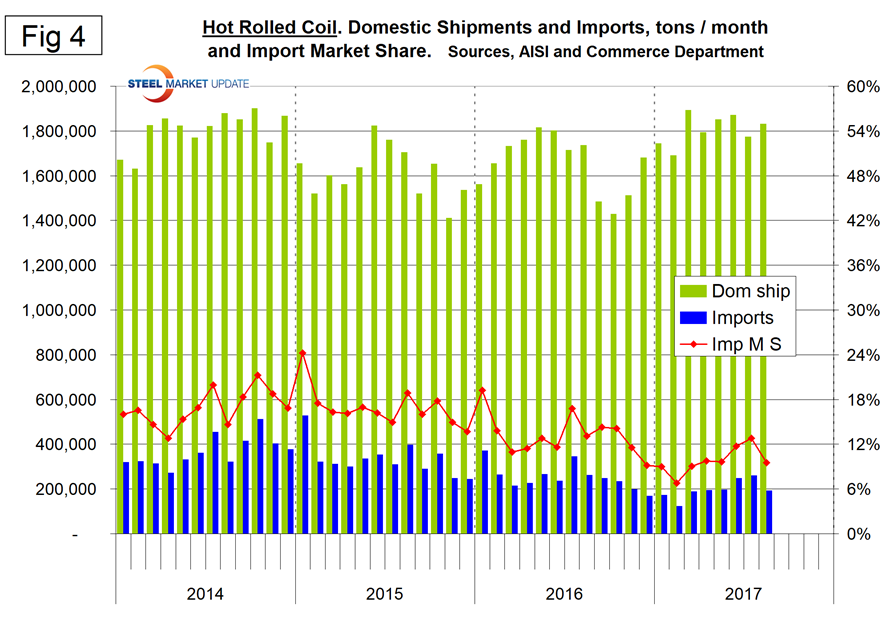
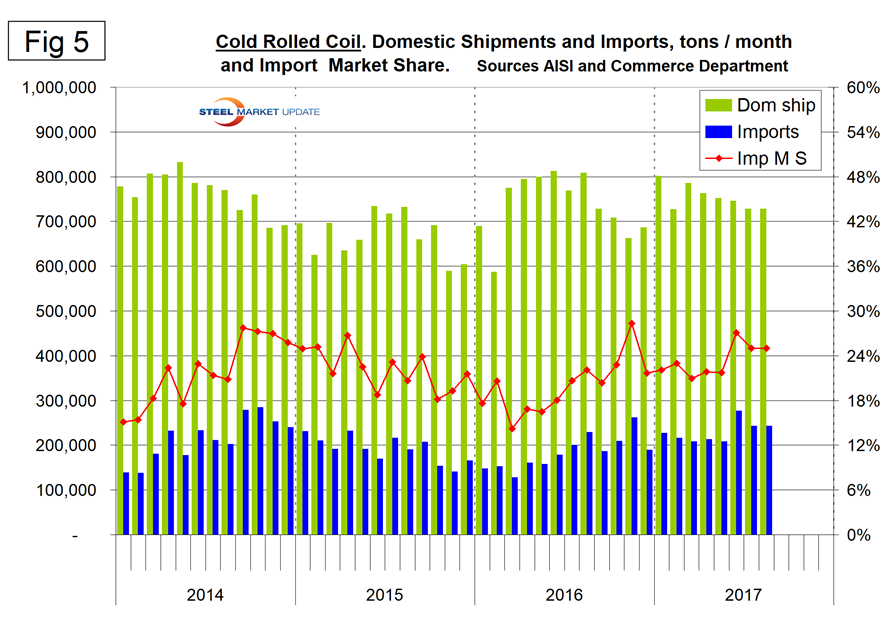
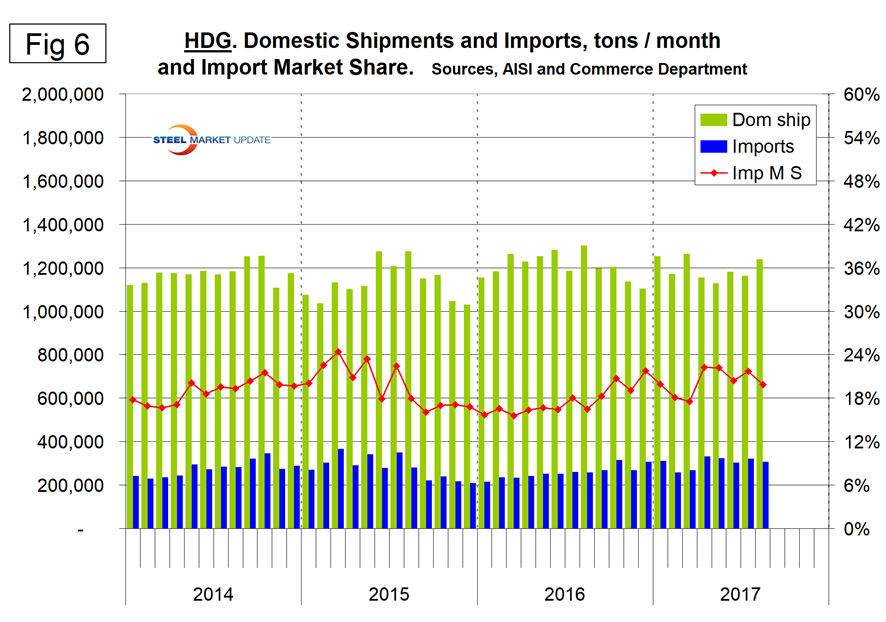
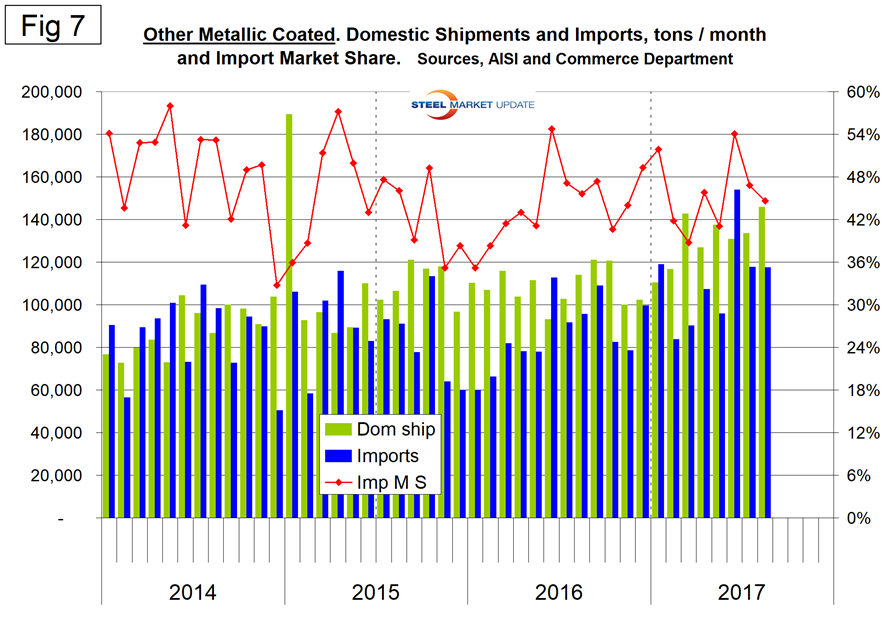
Figures 4-7 show U.S. mill shipments to domestic locations, imports and import market share of the four major sheet products. Note: the righthand import share axes are the same to give true comparability. HRC has the lowest import share followed by HDG, CRC and OMC, which is by far the highest.
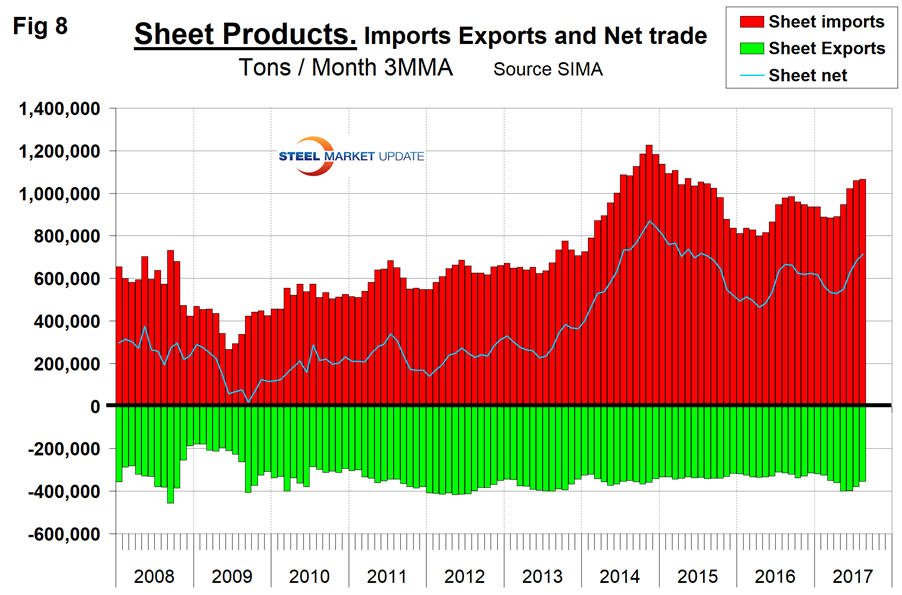
Net imports equals imports minus exports. Our analysis is based on the final volumes through August. We regard this as an important look at the overall trade picture and its effect on demand at the mill level. Figure 8 shows net sheet product imports on a 3MMA basis to be 713,078 tons in August, which was the highest since July 2015. Exports have increased in 2017, driven by the depreciation of the U.S. dollar on the international foreign exchange markets. Net sheet steel imports are high by historical standards.
Explanation: SMU publishes several import reports ranging from this very early look using licensed data to the very detailed analysis of final volumes by product, by district of entry and by source nation, which is available in the premium member section of our website. The early look, the latest of which you are reading now, has been based on three-month moving averages using the latest licensed data, either the preliminary or final data for the previous month and final data for earlier months. We recognize that the license data is subject to revisions, but believe that combining it with earlier months in this way gives a reasonably accurate assessment of volume trends by product as early as possible. We are more interested in direction than we are in absolute volumes at this stage. The main issue with the license data is that the month in which the tonnage arrives is not always the same month in which the license was recorded. In 2014 as a whole, our data showed that the reported licensed tonnage of all carbon and low alloy products was 2.3 percent less than actual receipts, close enough we believe to confidently include licensed data in this current update. The discrepancy declined continuously during the course of the 12-month evaluation as a longer time period was considered.
Statement from the Department of Commerce: The Steel Import Monitoring and Analysis (SIMA) System of the Department of Commerce collects and publishes data of steel mill product imports. By design, this information provides stakeholders valuable information on steel trade with the United States. This is achieved through two tools: the steel licensing program and the steel import monitor. All steel mill imports into the United States require a license issued by the SIMA office. The SIMA Licensing System is an online automatic system for users to register, apply for and receive licenses in a quick and timely manner. This online system allows importers to process imports with minimal effort and added efficiency. In addition to managing the licensing system, SIMA publishes near real-time aggregate data on steel mill imports into the United States. These data incorporate information collected from steel license applications and publicly released Census data. The data are displayed in tables and graphs for users to analyze various levels and changes in steel trade involving the United States. Additionally, SIMA provides data on U.S. steel mill exports, as well as imports and exports of select downstream steel products.


