

Market Data

December 7, 2017
Steel Mill Lead Times: Little Change
Written by Tim Triplett
Mill lead times have seen little change in the past month, according to the latest data from Steel Market Update’s flat roll market questionnaire, despite the price hikes announced by the mills two weeks ago. One of the key indicators tracked by SMU, lead times reflect the activity at the mills and the order levels they are seeing from their customers. Had the market balked at the price hikes, with buyers pulling back on orders, one would have expected lead times to shorten. Therefore, the lack of change could be interpreted as a positive sign for demand.
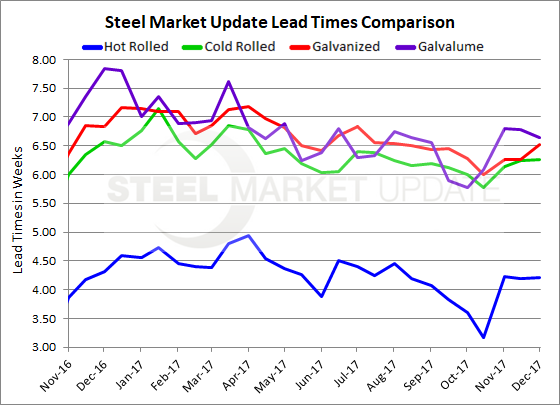
Hot rolled lead times averaged 4.21 weeks in early December, the same as last month, but a week longer than in mid-October when HRC lead times averaged 3.16 weeks. Last year at this time, in a period when hot rolled prices were on the rise, HRC lead times were about the same at 4.31 weeks.
Cold-rolled lead times remain a bit over six weeks (6.26 weeks), up slightly from 6.14 weeks a month ago and about the same level as this time last year.
Galvanized lead times inched up a bit to 6.53 weeks from an average of 6.26 weeks over the past month. Last year at this time, GI lead times were slightly higher at 6.84 weeks. Galvalume lead times, at 6.64 weeks, are down slightly from 6.80 weeks a month ago. One year ago, AZ lead times were a bit higher at 7.85 weeks.
Note: These lead times are based on the average from manufacturers and steel service centers who participated in this week’s SMU market trends analysis. Our lead times do not predict what any individual may get from any specific mill supplier. Look to your mill rep for actual lead times. Our lead times are meant only to identify trends and changes in the marketplace. To see an interactive history of our Steel Mill Lead Times data, visit our website here.


